Quick Links
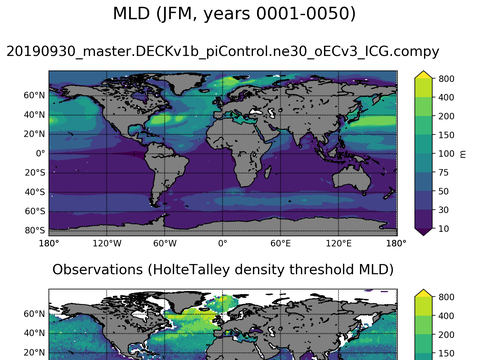
Global Mixed-Layer Depth
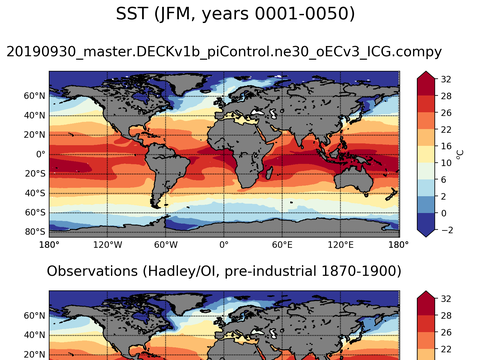
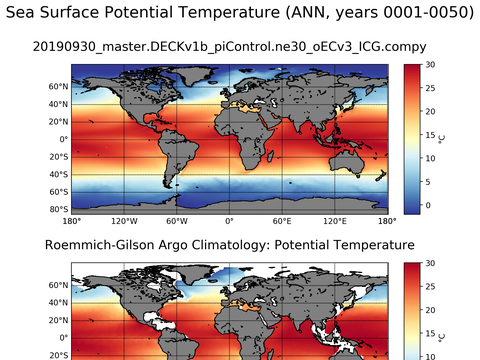
Global Sea Surface Temperature
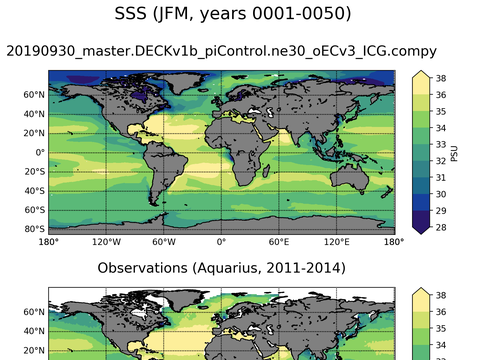
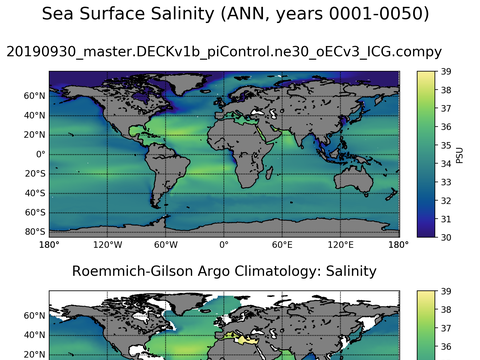
Global Sea Surface Salinity
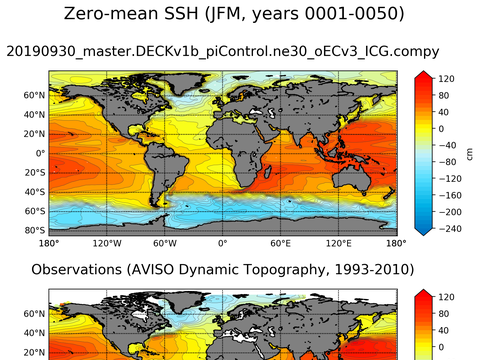
Global Sea Surface Height
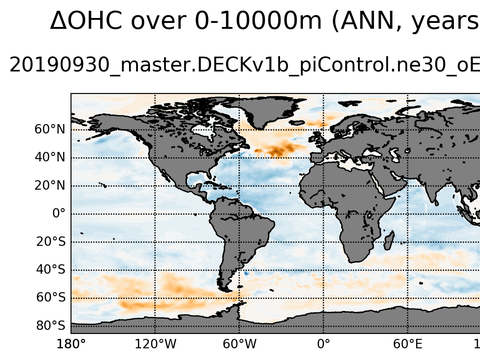
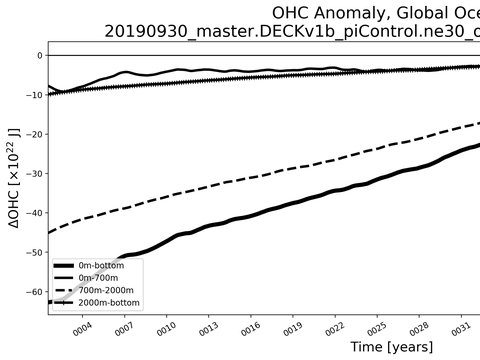
Global OHC Anomaly
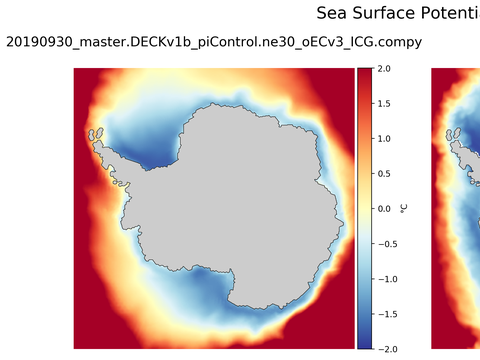
Antarctic Potential Temperature
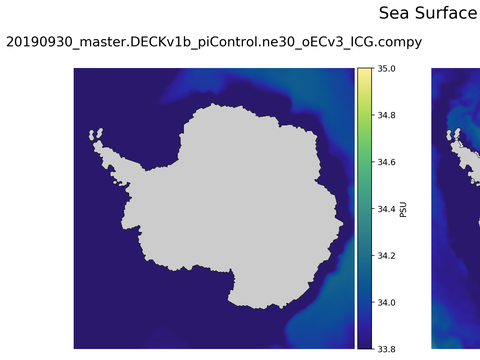
Antarctic Salinity
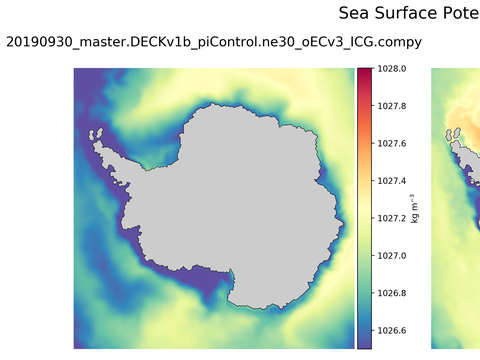
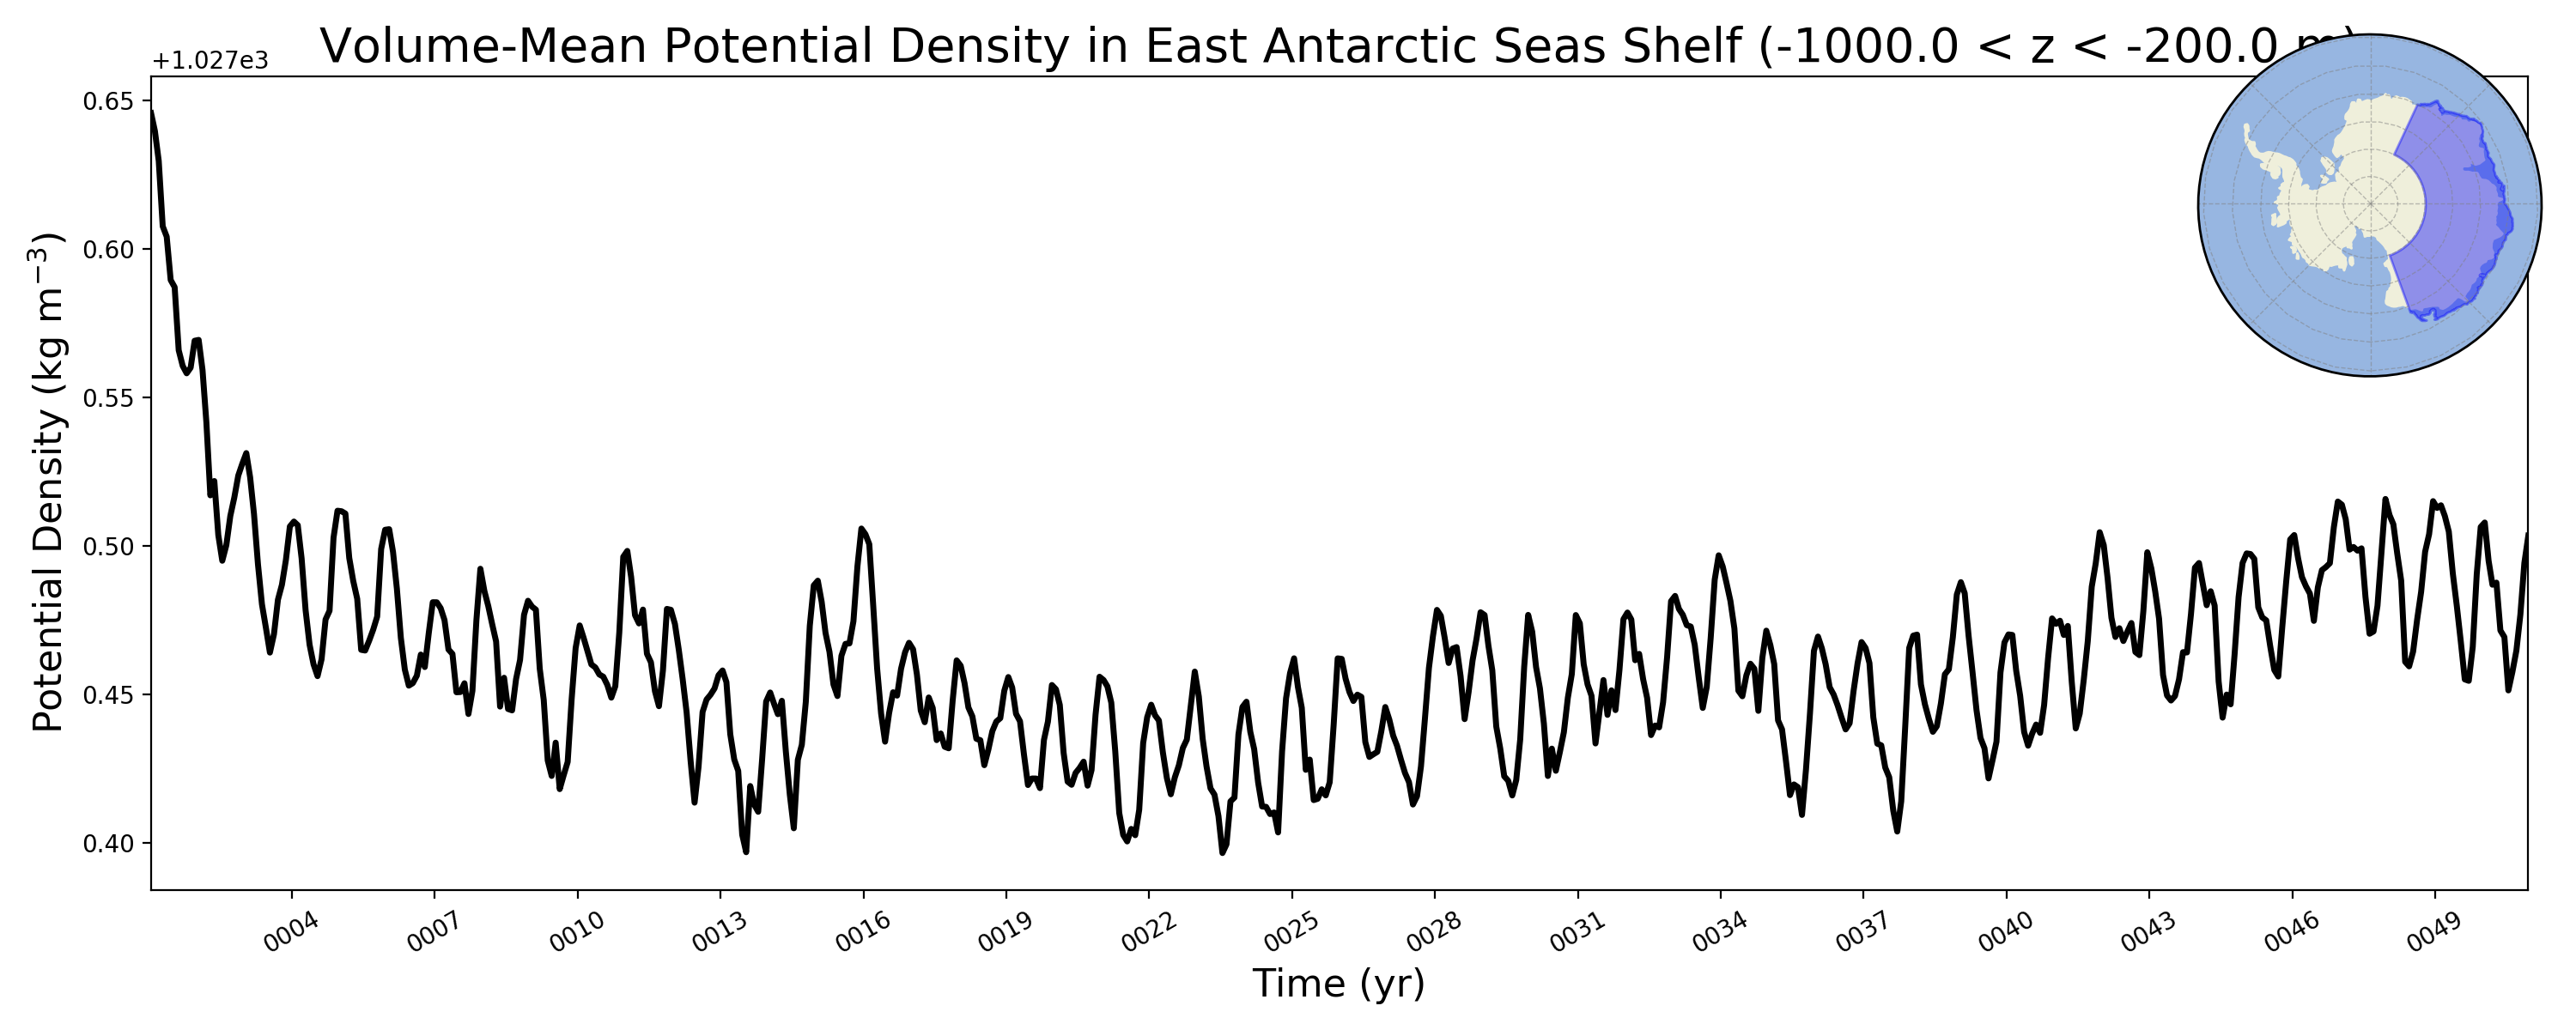
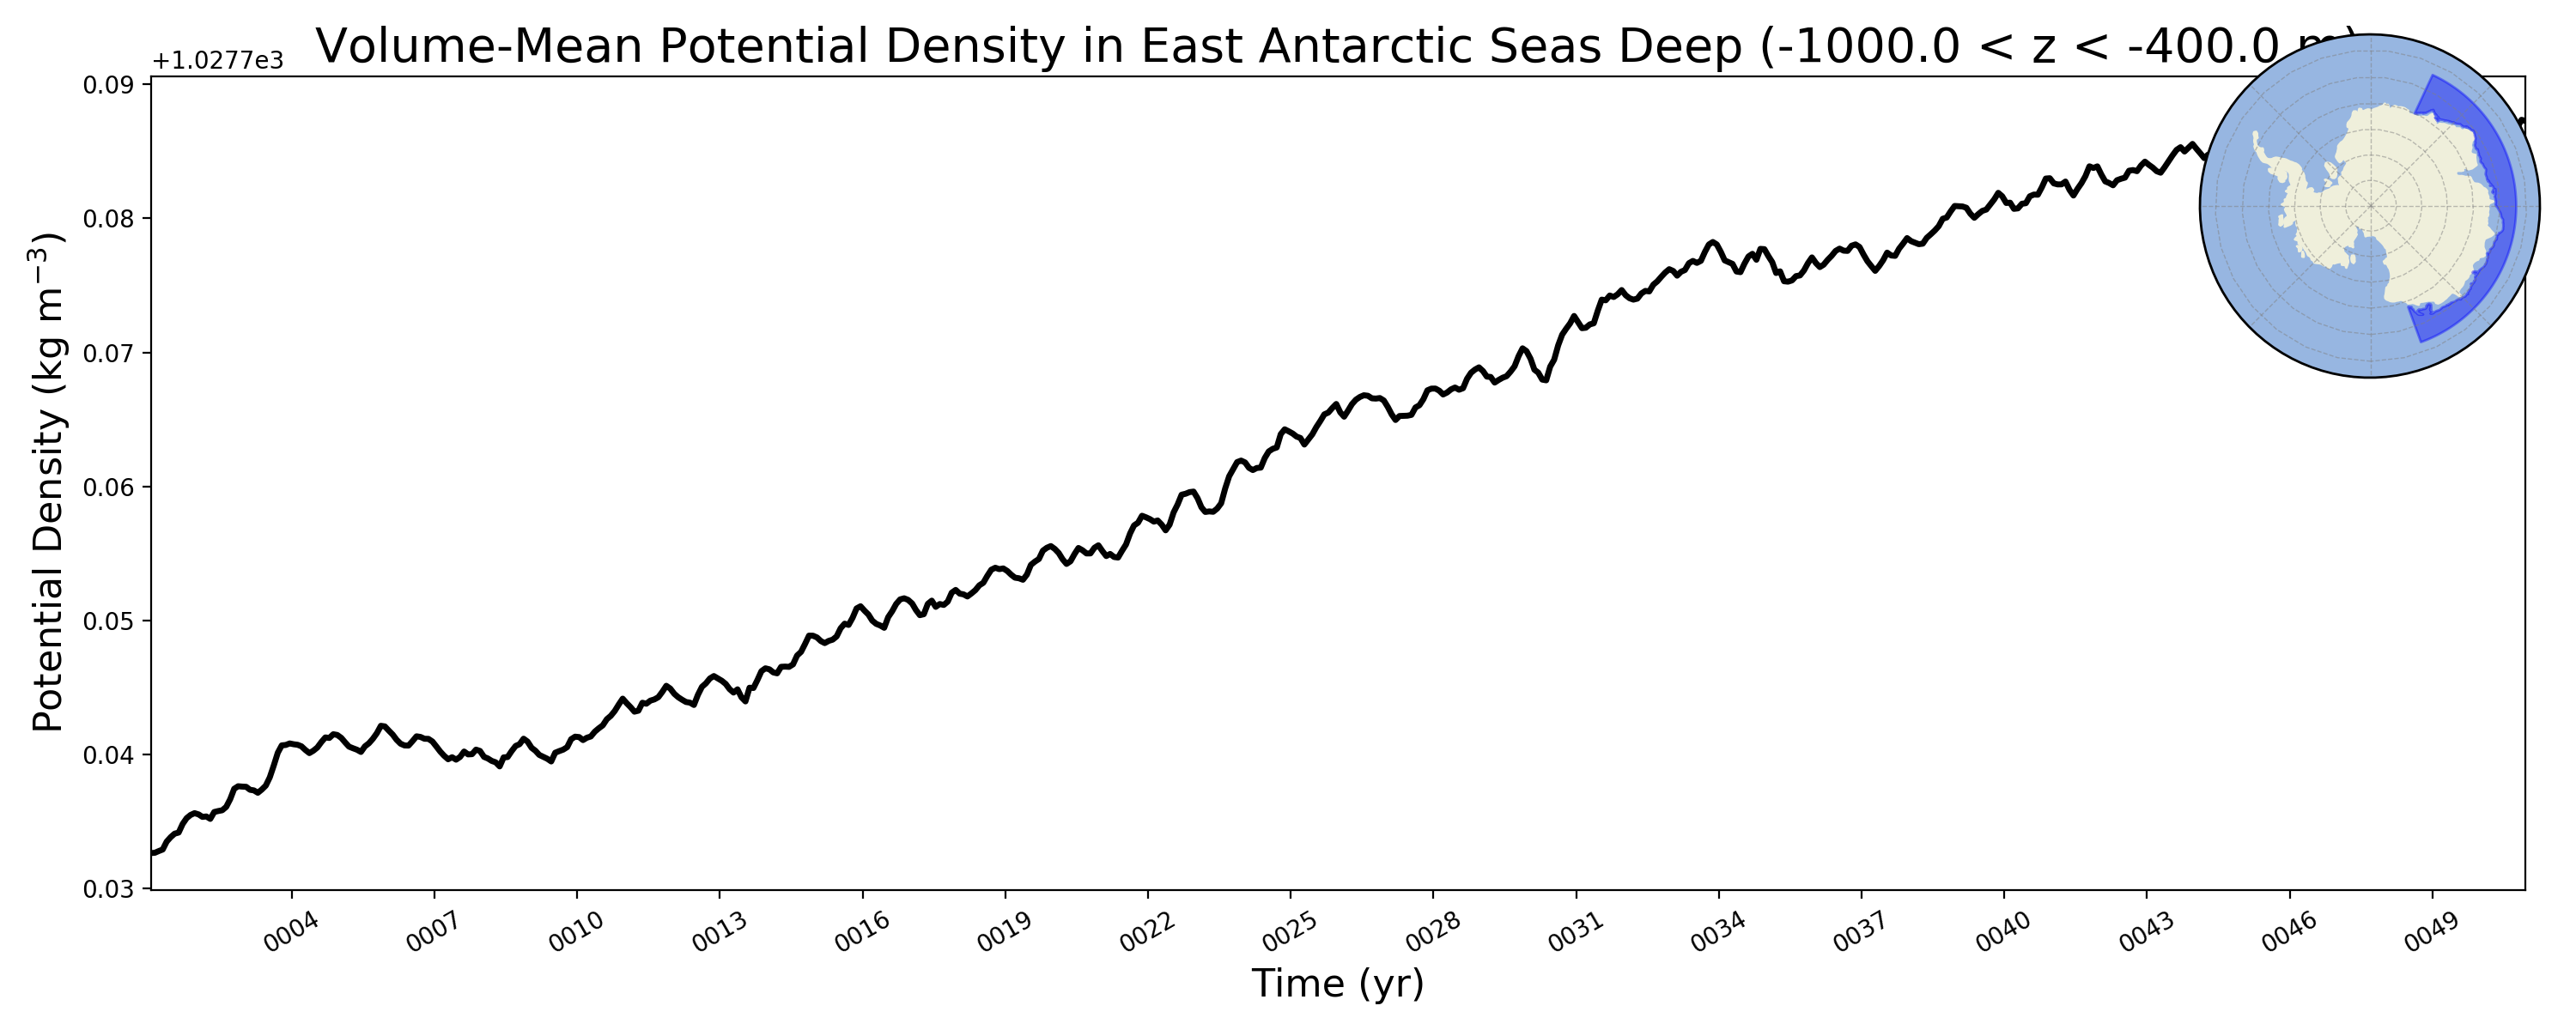
Antarctic Potential Density
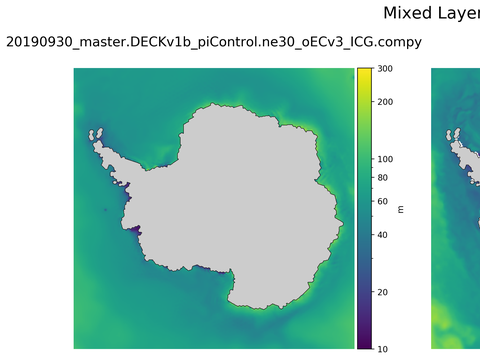
Antarctic Mixed Layer Depth
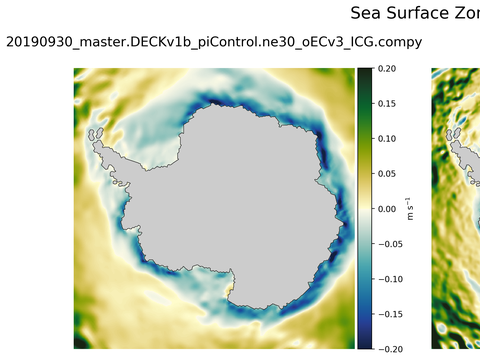
Antarctic Zonal Velocity
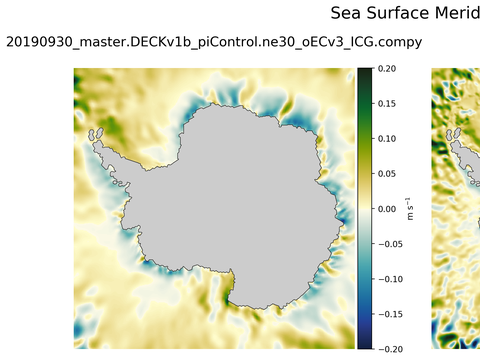
Antarctic Meridional Velocity
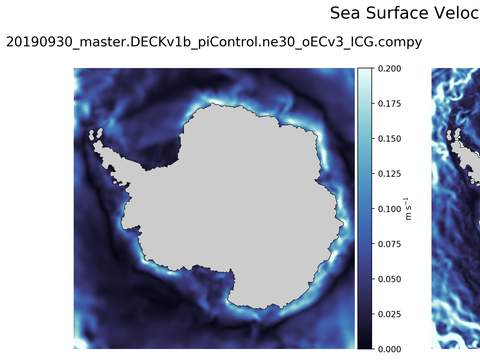
Antarctic Velocity Magnitude
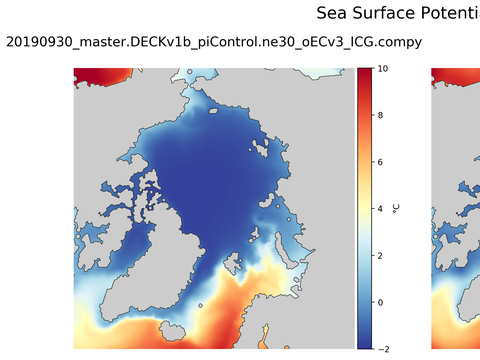
Arctic Potential Temperature
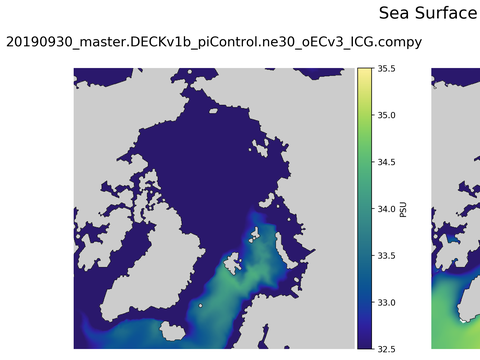
Arctic Salinity
Global Argo Potential Temperature
Global Argo Salinity
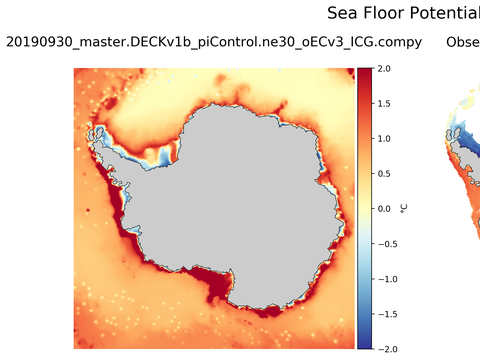
Antarctic Seafloor Maps
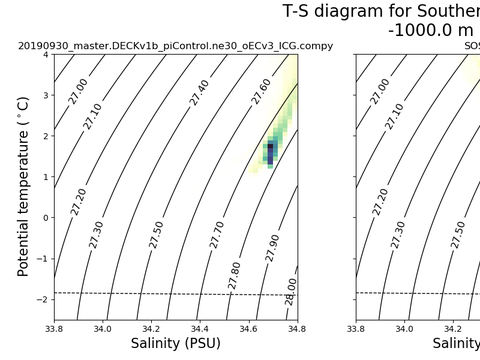
T-S Diagrams
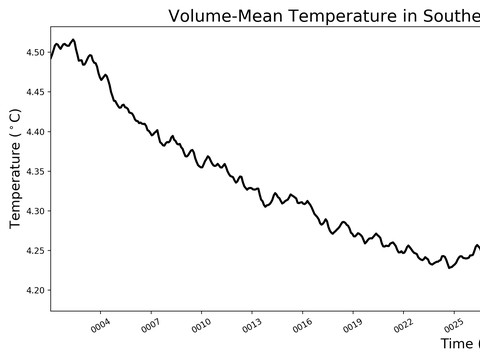
Antarctic Regions Time Series
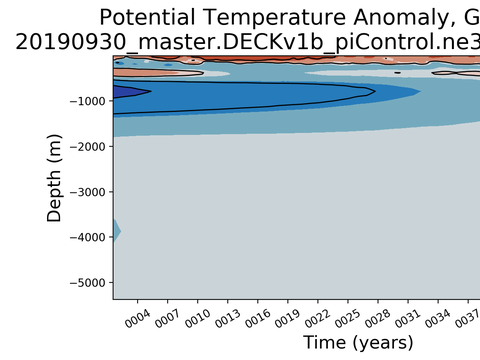
Trends vs Depth
Time Series
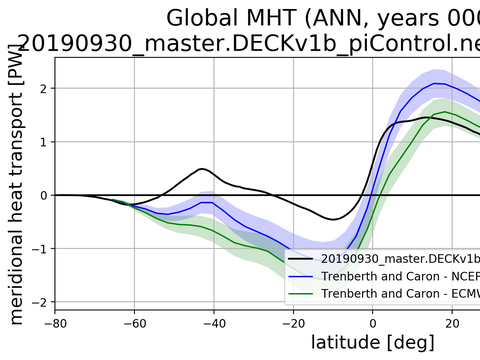
Meridional Heat Transport
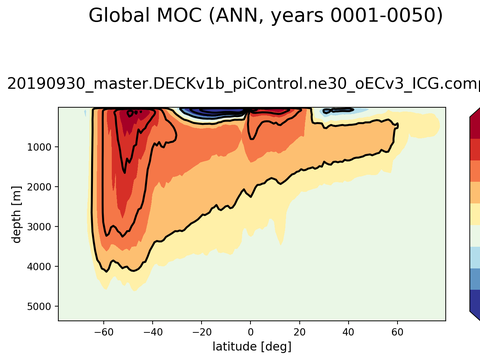
Meridional Overturning Streamfunction
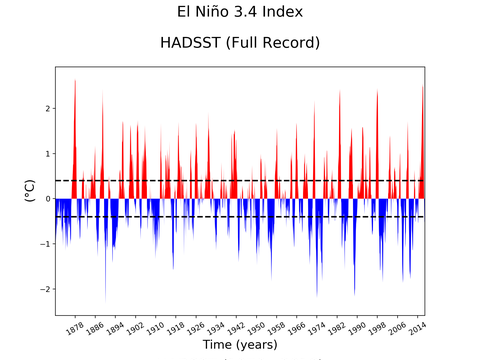
El Niño 3.4 Climate Index
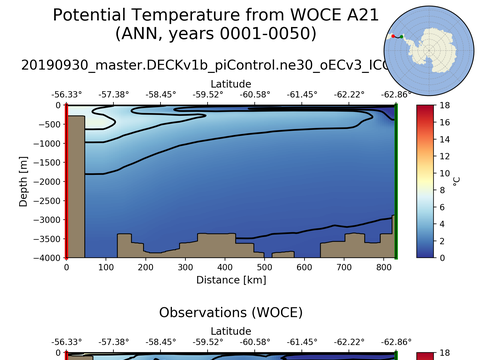
WOCE Transects
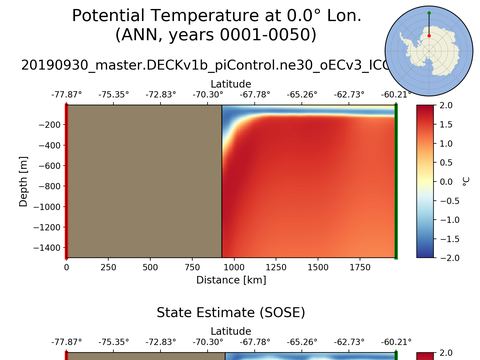
SOSE Transects
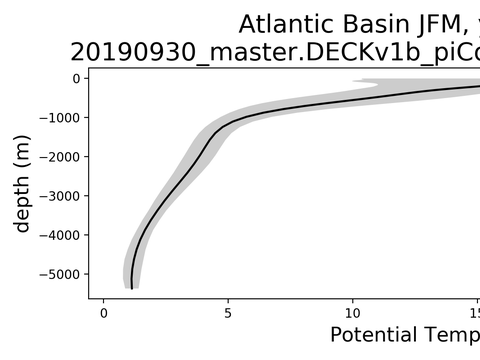
Ocean Basin Profiles
Observations: Holte-Talley ARGO

JFM

JAS

ANN
Observations: Hadley-NOAA-OI

JFM

JAS

ANN
Observations: Aquarius

JFM

JAS

ANN
Observations: AVISO

JFM

JAS

ANN

ANN

ANN

ANN

ANN
State Estimate: SOSE

ANN surface

ANN z=-200 m

ANN z=-400 m

ANN z=-600 m

ANN z=-800 m

ANN floor

JFM surface

JFM z=-200 m

JFM z=-400 m

JFM z=-600 m

JFM z=-800 m

JFM floor

JAS surface

JAS z=-200 m

JAS z=-400 m

JAS z=-600 m

JAS z=-800 m

JAS floor
State Estimate: SOSE

ANN surface

ANN z=-200 m

ANN z=-400 m

ANN z=-600 m

ANN z=-800 m

ANN floor

JFM surface

JFM z=-200 m

JFM z=-400 m

JFM z=-600 m

JFM z=-800 m

JFM floor

JAS surface

JAS z=-200 m

JAS z=-400 m

JAS z=-600 m

JAS z=-800 m

JAS floor
State Estimate: SOSE

ANN surface

ANN z=-200 m

ANN z=-400 m

ANN z=-600 m

ANN z=-800 m

ANN floor

JFM surface

JFM z=-200 m

JFM z=-400 m

JFM z=-600 m

JFM z=-800 m

JFM floor

JAS surface

JAS z=-200 m

JAS z=-400 m

JAS z=-600 m

JAS z=-800 m

JAS floor
State Estimate: SOSE

ANN

JFM

JAS
State Estimate: SOSE

ANN surface

ANN z=-200 m

ANN z=-400 m

ANN z=-600 m

ANN z=-800 m

ANN floor

JFM surface

JFM z=-200 m

JFM z=-400 m

JFM z=-600 m

JFM z=-800 m

JFM floor

JAS surface

JAS z=-200 m

JAS z=-400 m

JAS z=-600 m

JAS z=-800 m

JAS floor
State Estimate: SOSE

ANN surface

ANN z=-200 m

ANN z=-400 m

ANN z=-600 m

ANN z=-800 m

ANN floor

JFM surface

JFM z=-200 m

JFM z=-400 m

JFM z=-600 m

JFM z=-800 m

JFM floor

JAS surface

JAS z=-200 m

JAS z=-400 m

JAS z=-600 m

JAS z=-800 m

JAS floor
State Estimate: SOSE

ANN surface

ANN z=-200 m

ANN z=-400 m

ANN z=-600 m

ANN z=-800 m

ANN floor

JFM surface

JFM z=-200 m

JFM z=-400 m

JFM z=-600 m

JFM z=-800 m

JFM floor

JAS surface

JAS z=-200 m

JAS z=-400 m

JAS z=-600 m

JAS z=-800 m

JAS floor
WOA18 Climatology

ANN surface

ANN z=-500 m

ANN z=-1000 m

JFM surface

JFM z=-500 m

JFM z=-1000 m

JAS surface

JAS z=-500 m

JAS z=-1000 m
WOA18 Climatology

ANN surface

ANN z=-500 m

ANN z=-1000 m

JFM surface

JFM z=-500 m

JFM z=-1000 m

JAS surface

JAS z=-500 m

JAS z=-1000 m
Roemmich-Gilson Climatology: Argo

ANN surface

ANN z=-25 m

ANN z=-50 m

ANN z=-100 m

ANN z=-150 m

ANN z=-200 m

ANN z=-400 m

ANN z=-800 m

ANN z=-1500 m

JAS surface

JAS z=-25 m

JAS z=-50 m

JAS z=-100 m

JAS z=-150 m

JAS z=-200 m

JAS z=-400 m

JAS z=-800 m

JAS z=-1500 m

JFM surface

JFM z=-25 m

JFM z=-50 m

JFM z=-100 m

JFM z=-150 m

JFM z=-200 m

JFM z=-400 m

JFM z=-800 m

JFM z=-1500 m
Roemmich-Gilson Climatology: Argo

ANN surface

ANN z=-25 m

ANN z=-50 m

ANN z=-100 m

ANN z=-150 m

ANN z=-200 m

ANN z=-400 m

ANN z=-600 m

ANN z=-800 m

ANN z=-1500 m

JFM surface

JFM z=-25 m

JFM z=-50 m

JFM z=-100 m

JFM z=-150 m

JFM z=-200 m

JFM z=-400 m

JFM z=-600 m

JFM z=-800 m

JFM z=-1500 m

JAS surface

JAS z=-25 m

JAS z=-50 m

JAS z=-100 m

JAS z=-150 m

JAS z=-200 m

JAS z=-400 m

JAS z=-600 m

JAS z=-800 m

JAS z=-1500 m
Potential Temperature

ANN floor

JFM floor

JAS floor
Salinity

ANN floor

JFM floor

JAS floor
Potential Density

ANN floor

JFM floor

JAS floor
Antarctic Regions
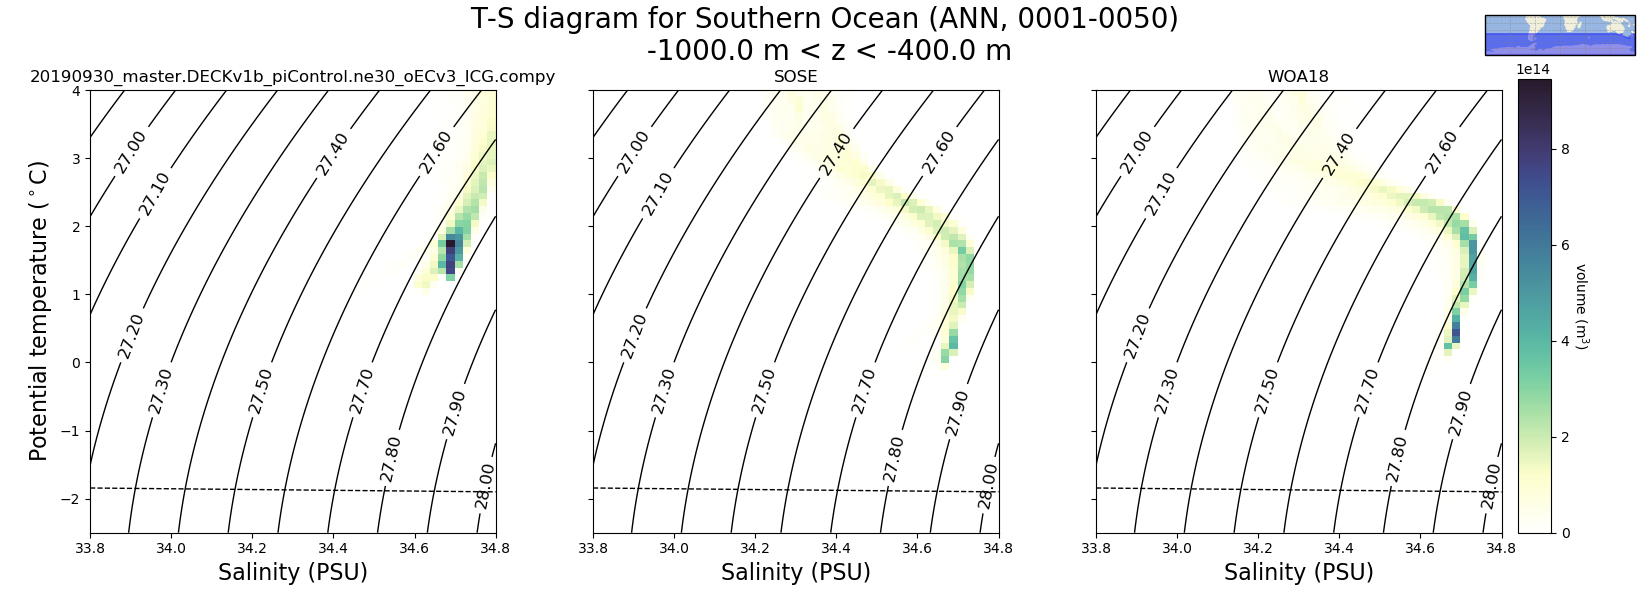
Southern Ocean
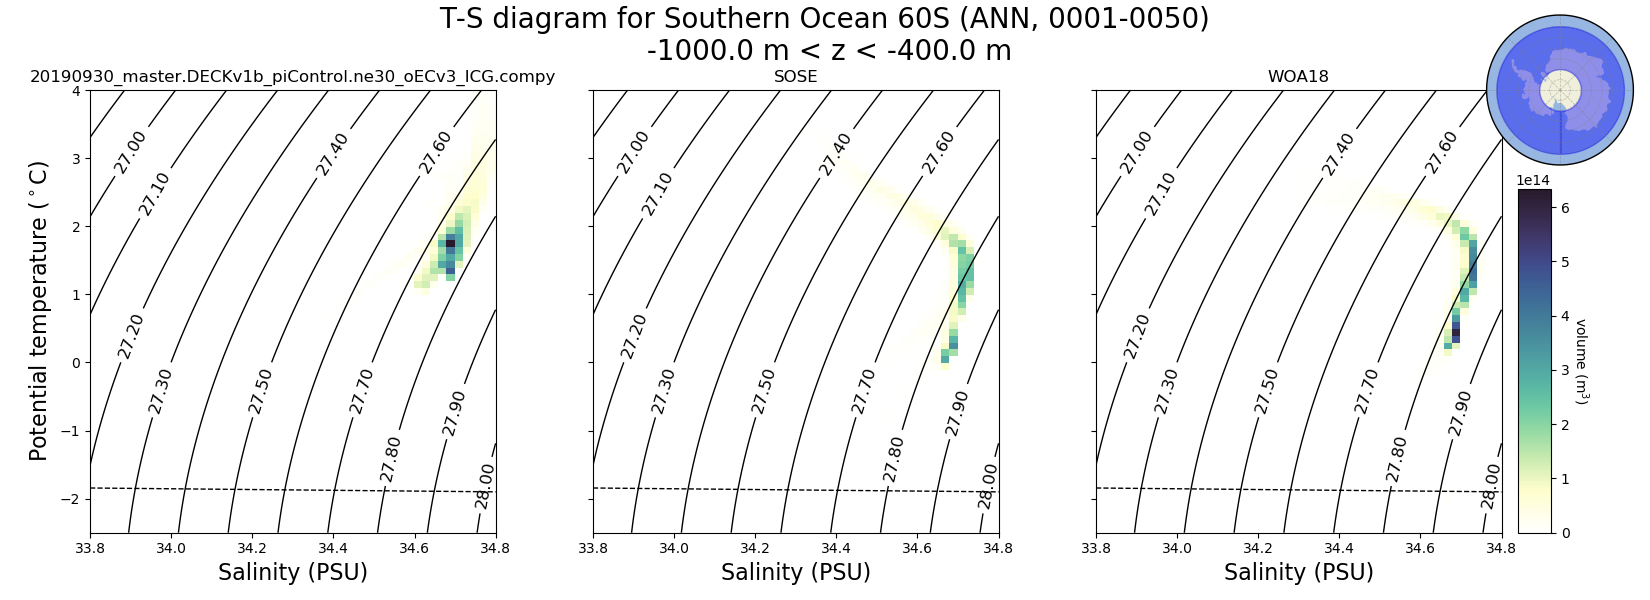
Southern Ocean 60S
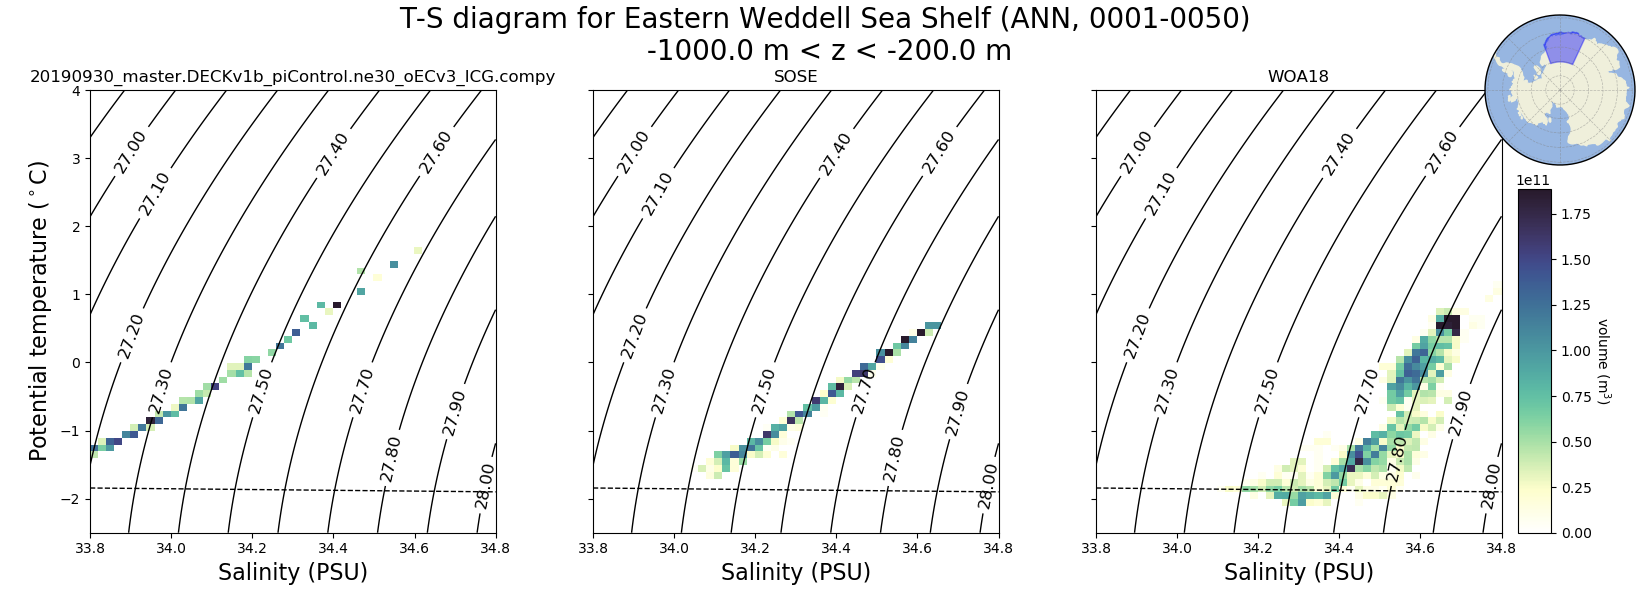
Eastern Weddell Sea Shelf
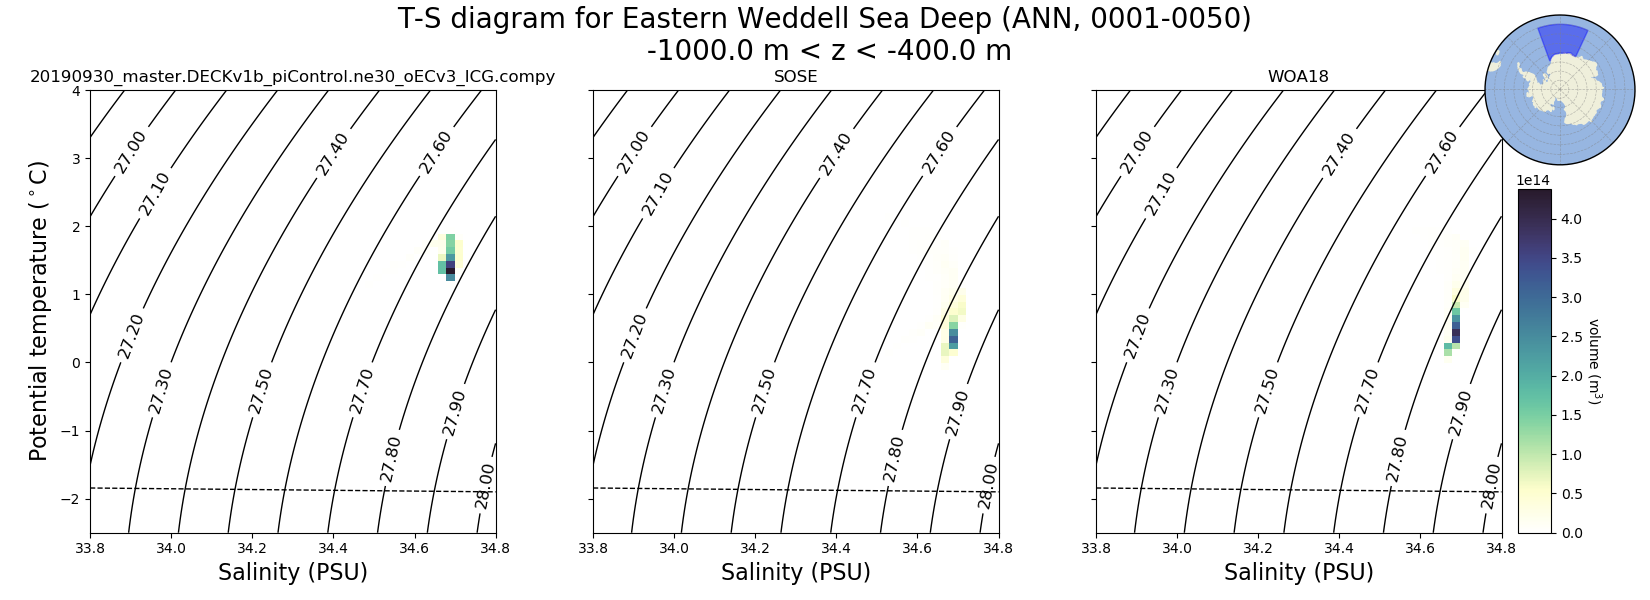
Eastern Weddell Sea Deep
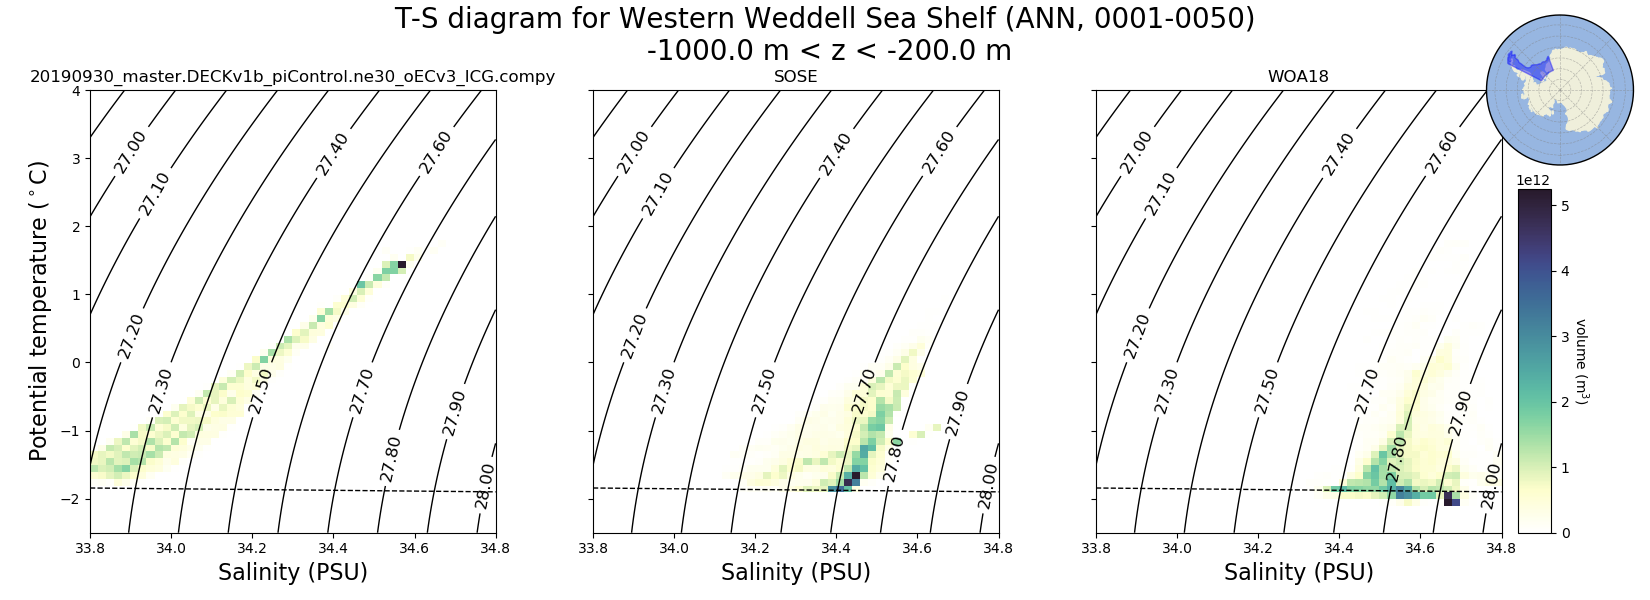
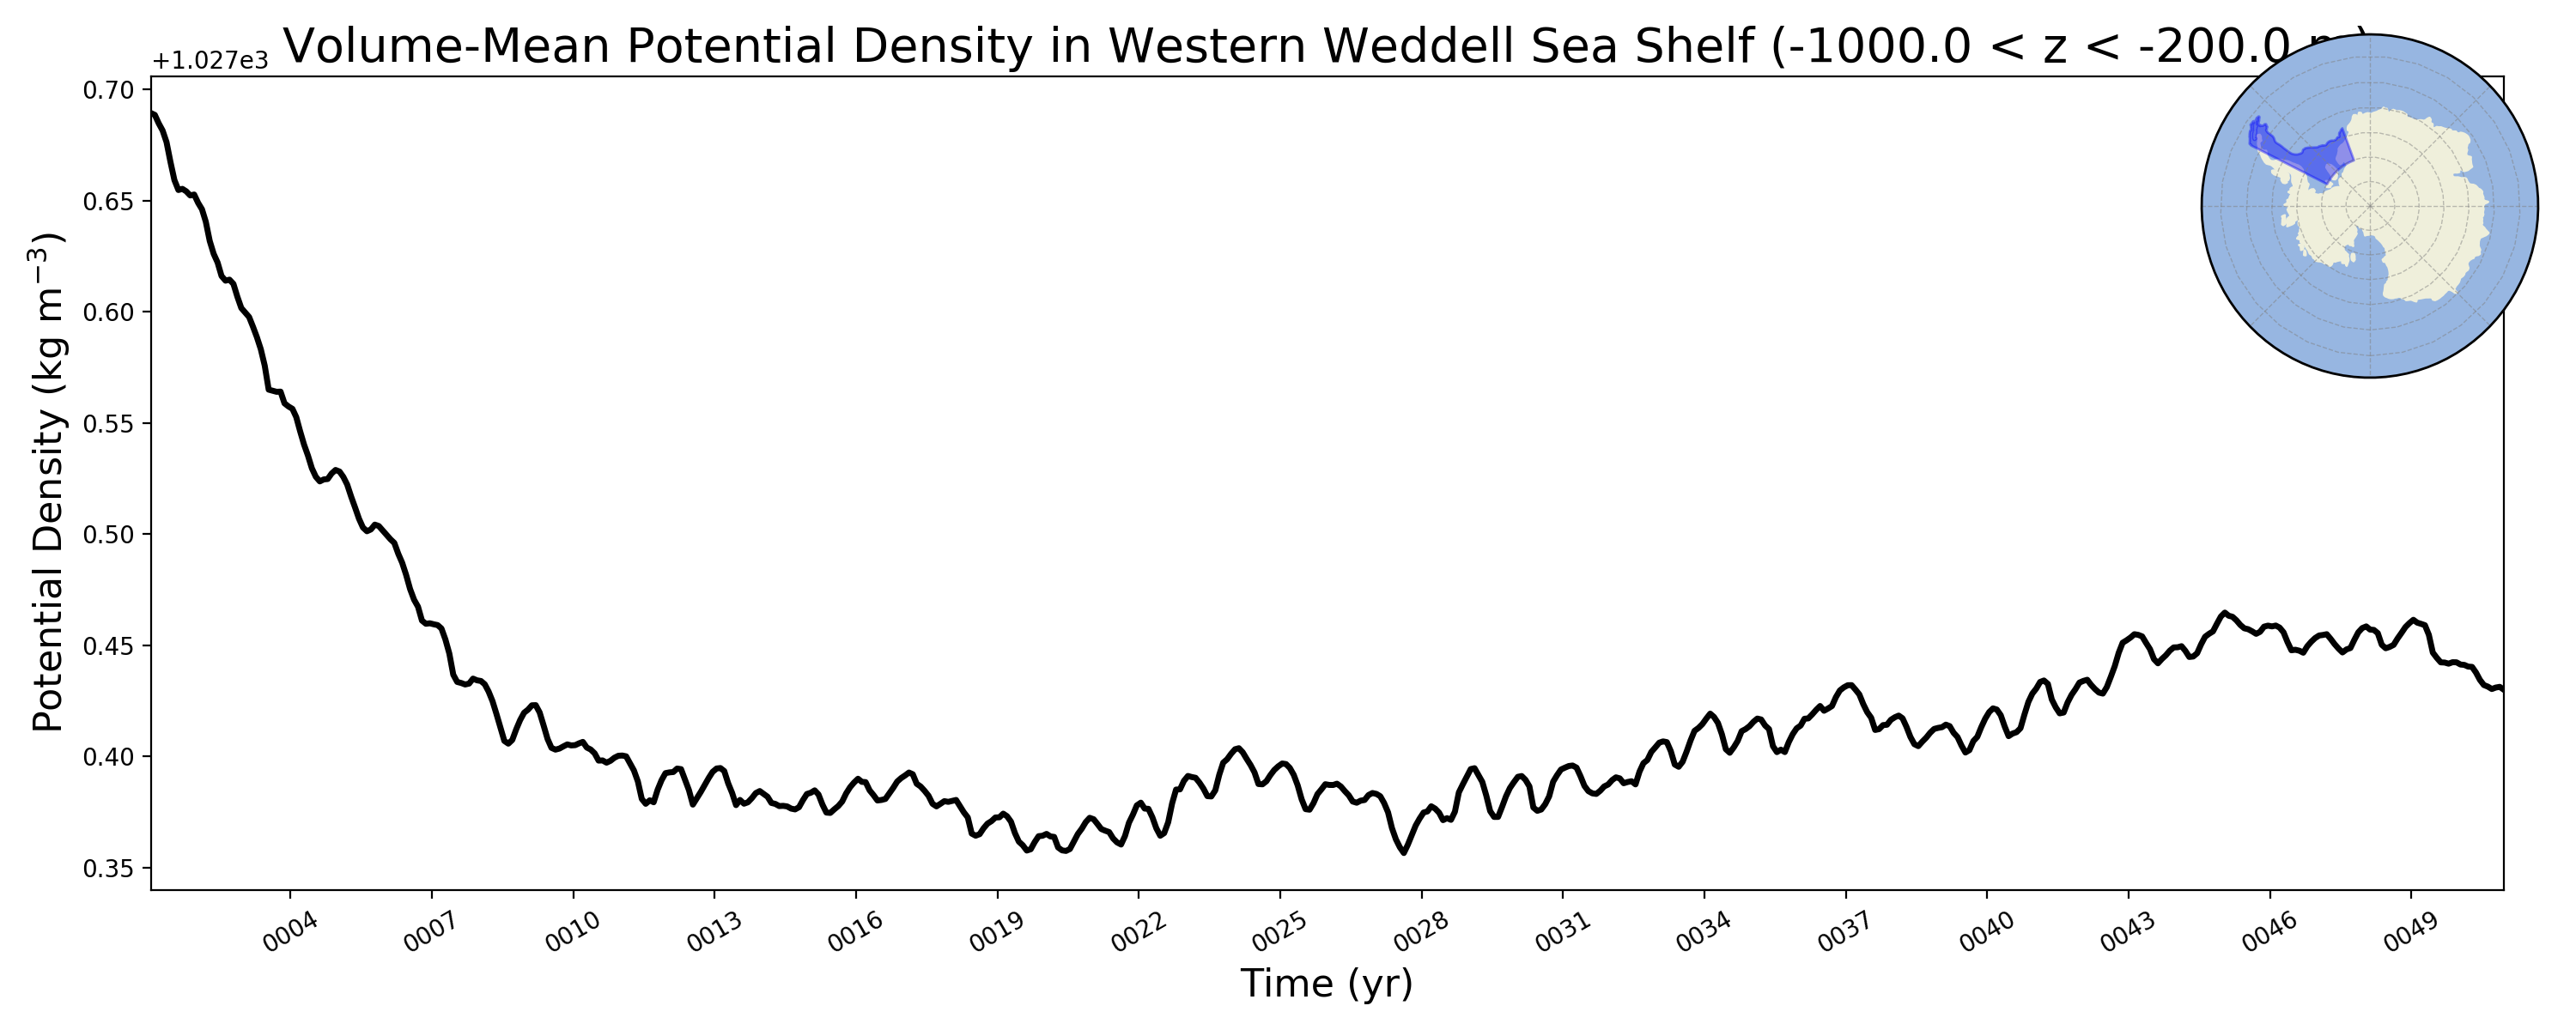
Western Weddell Sea Shelf
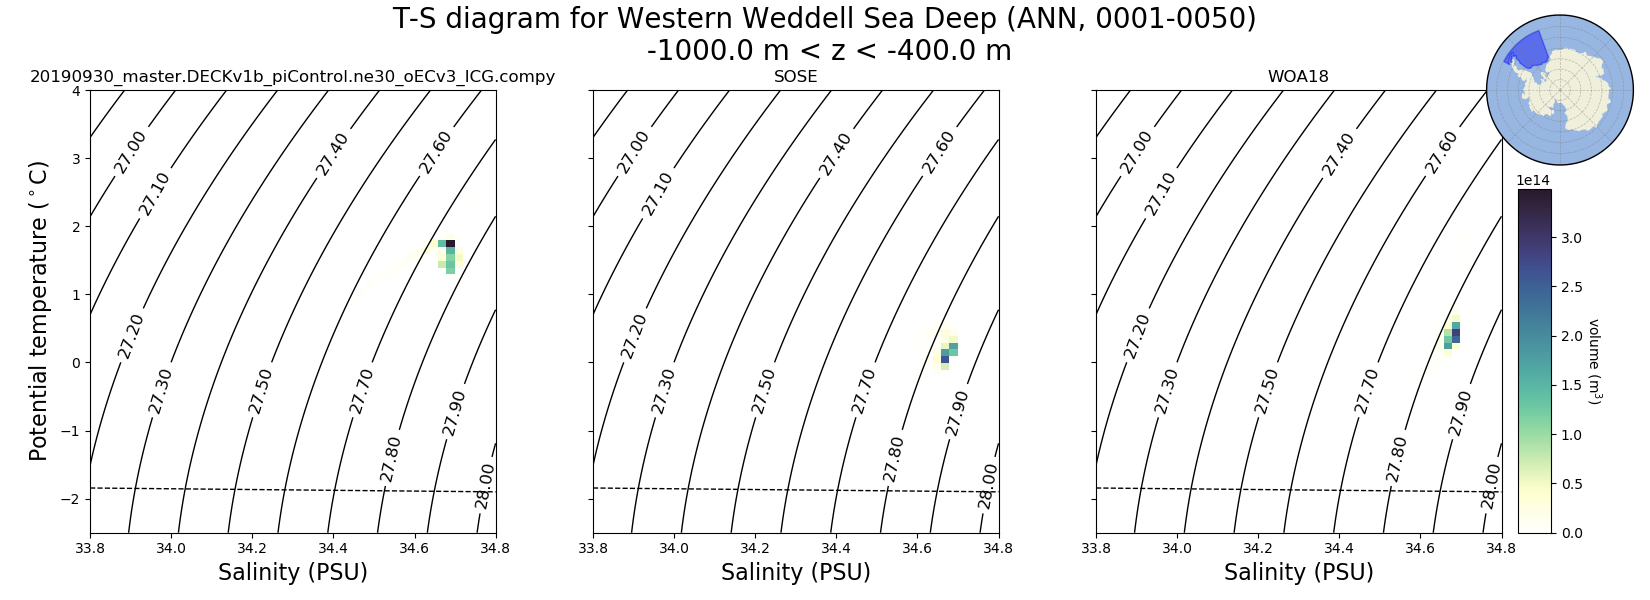
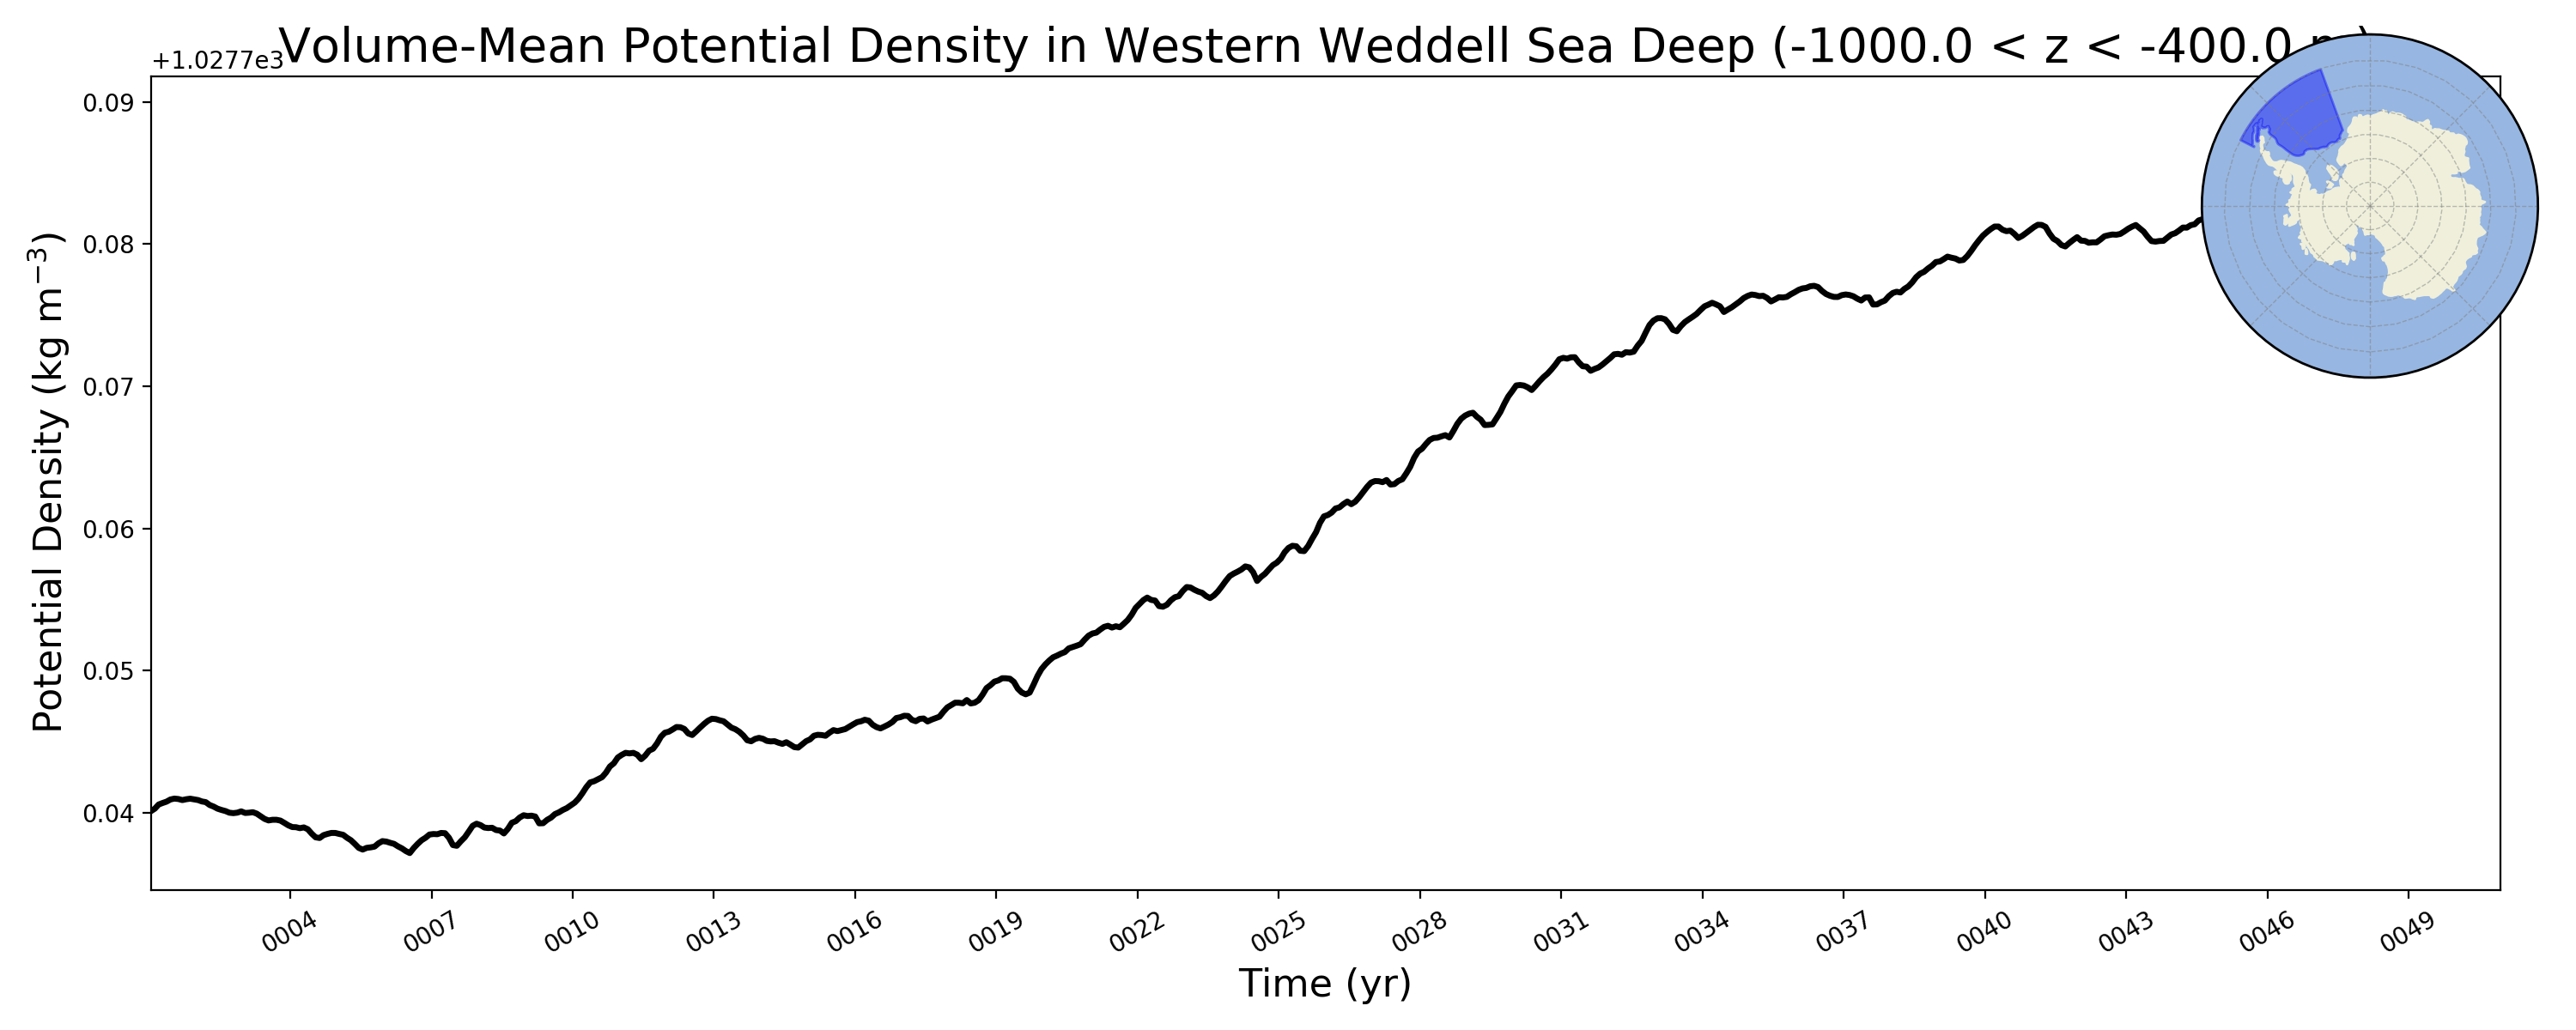
Western Weddell Sea Deep
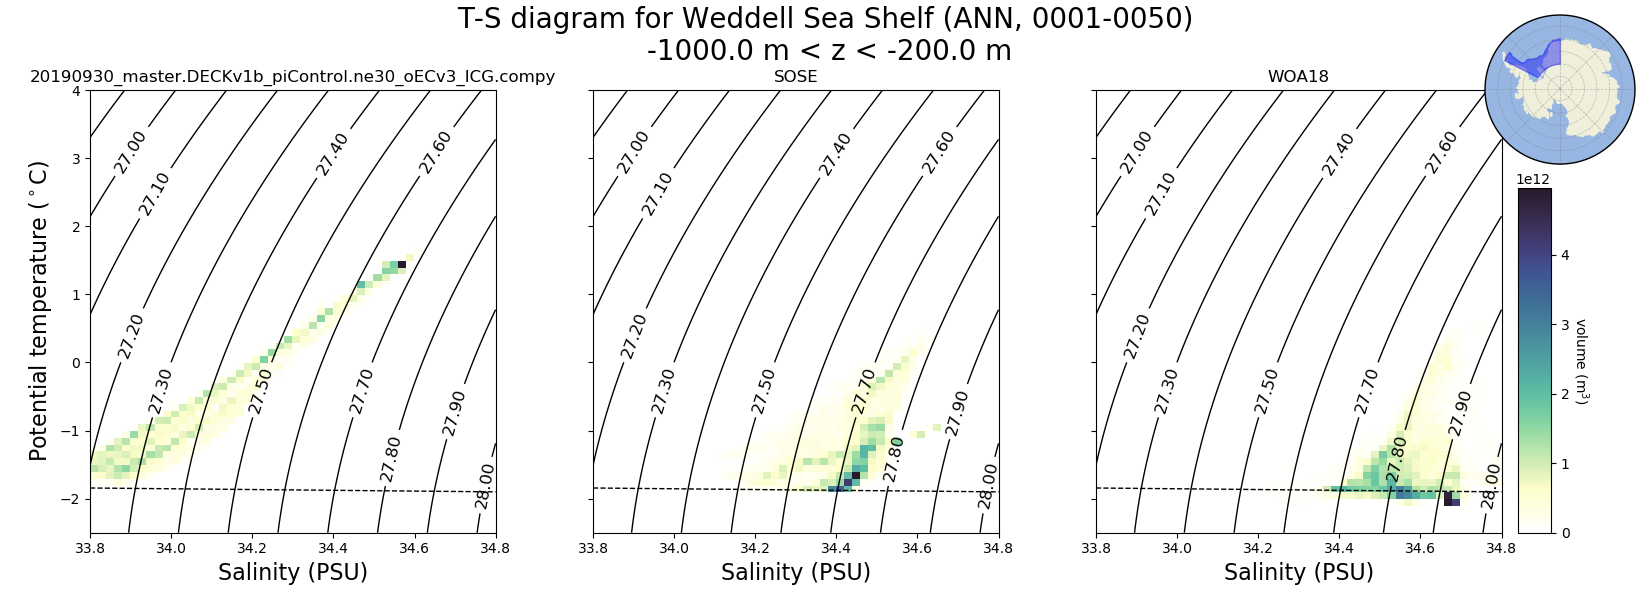
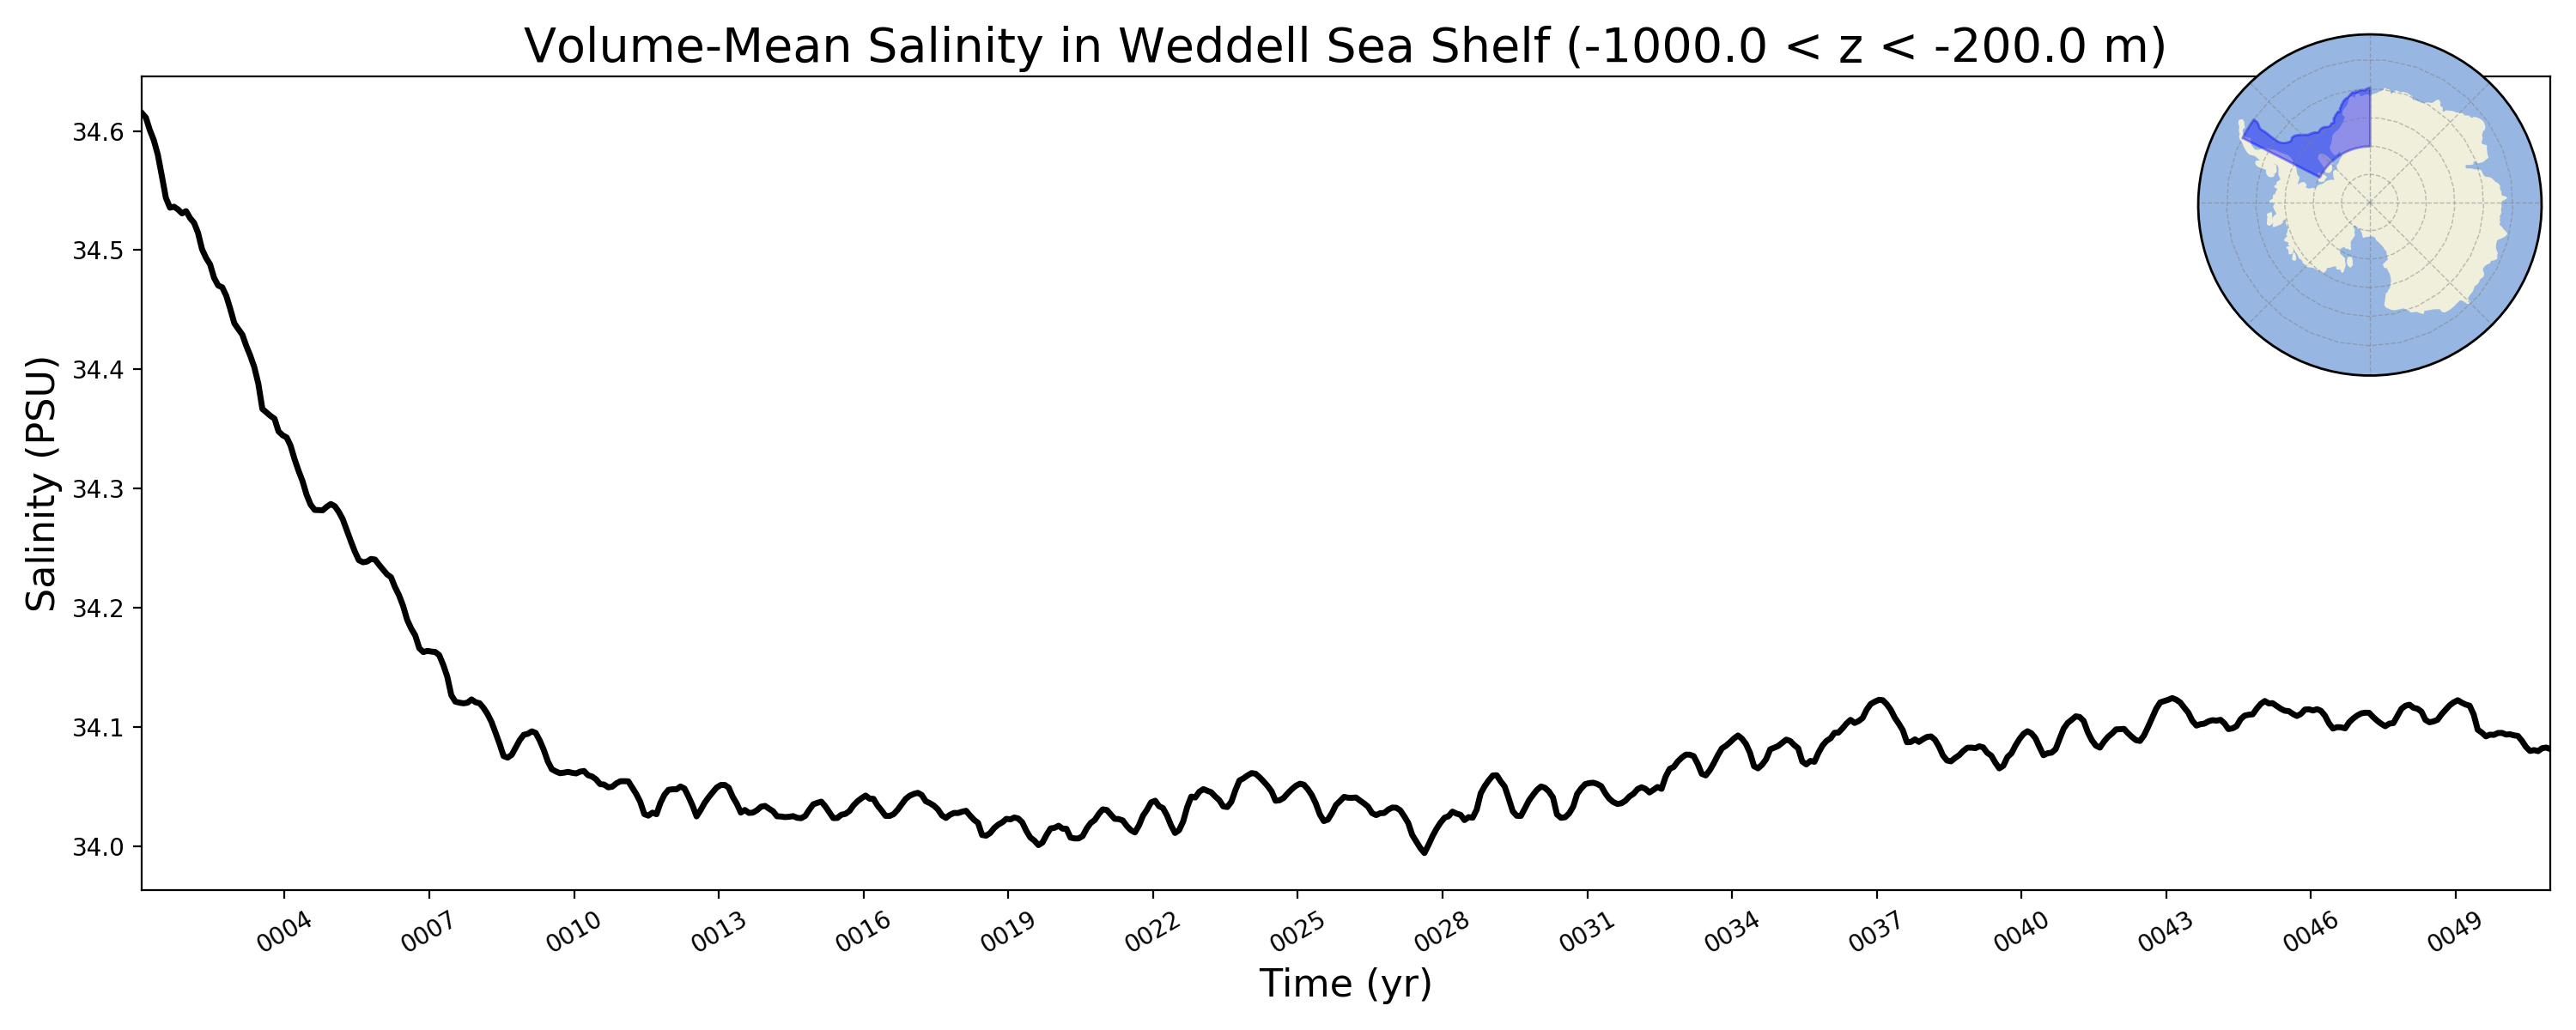
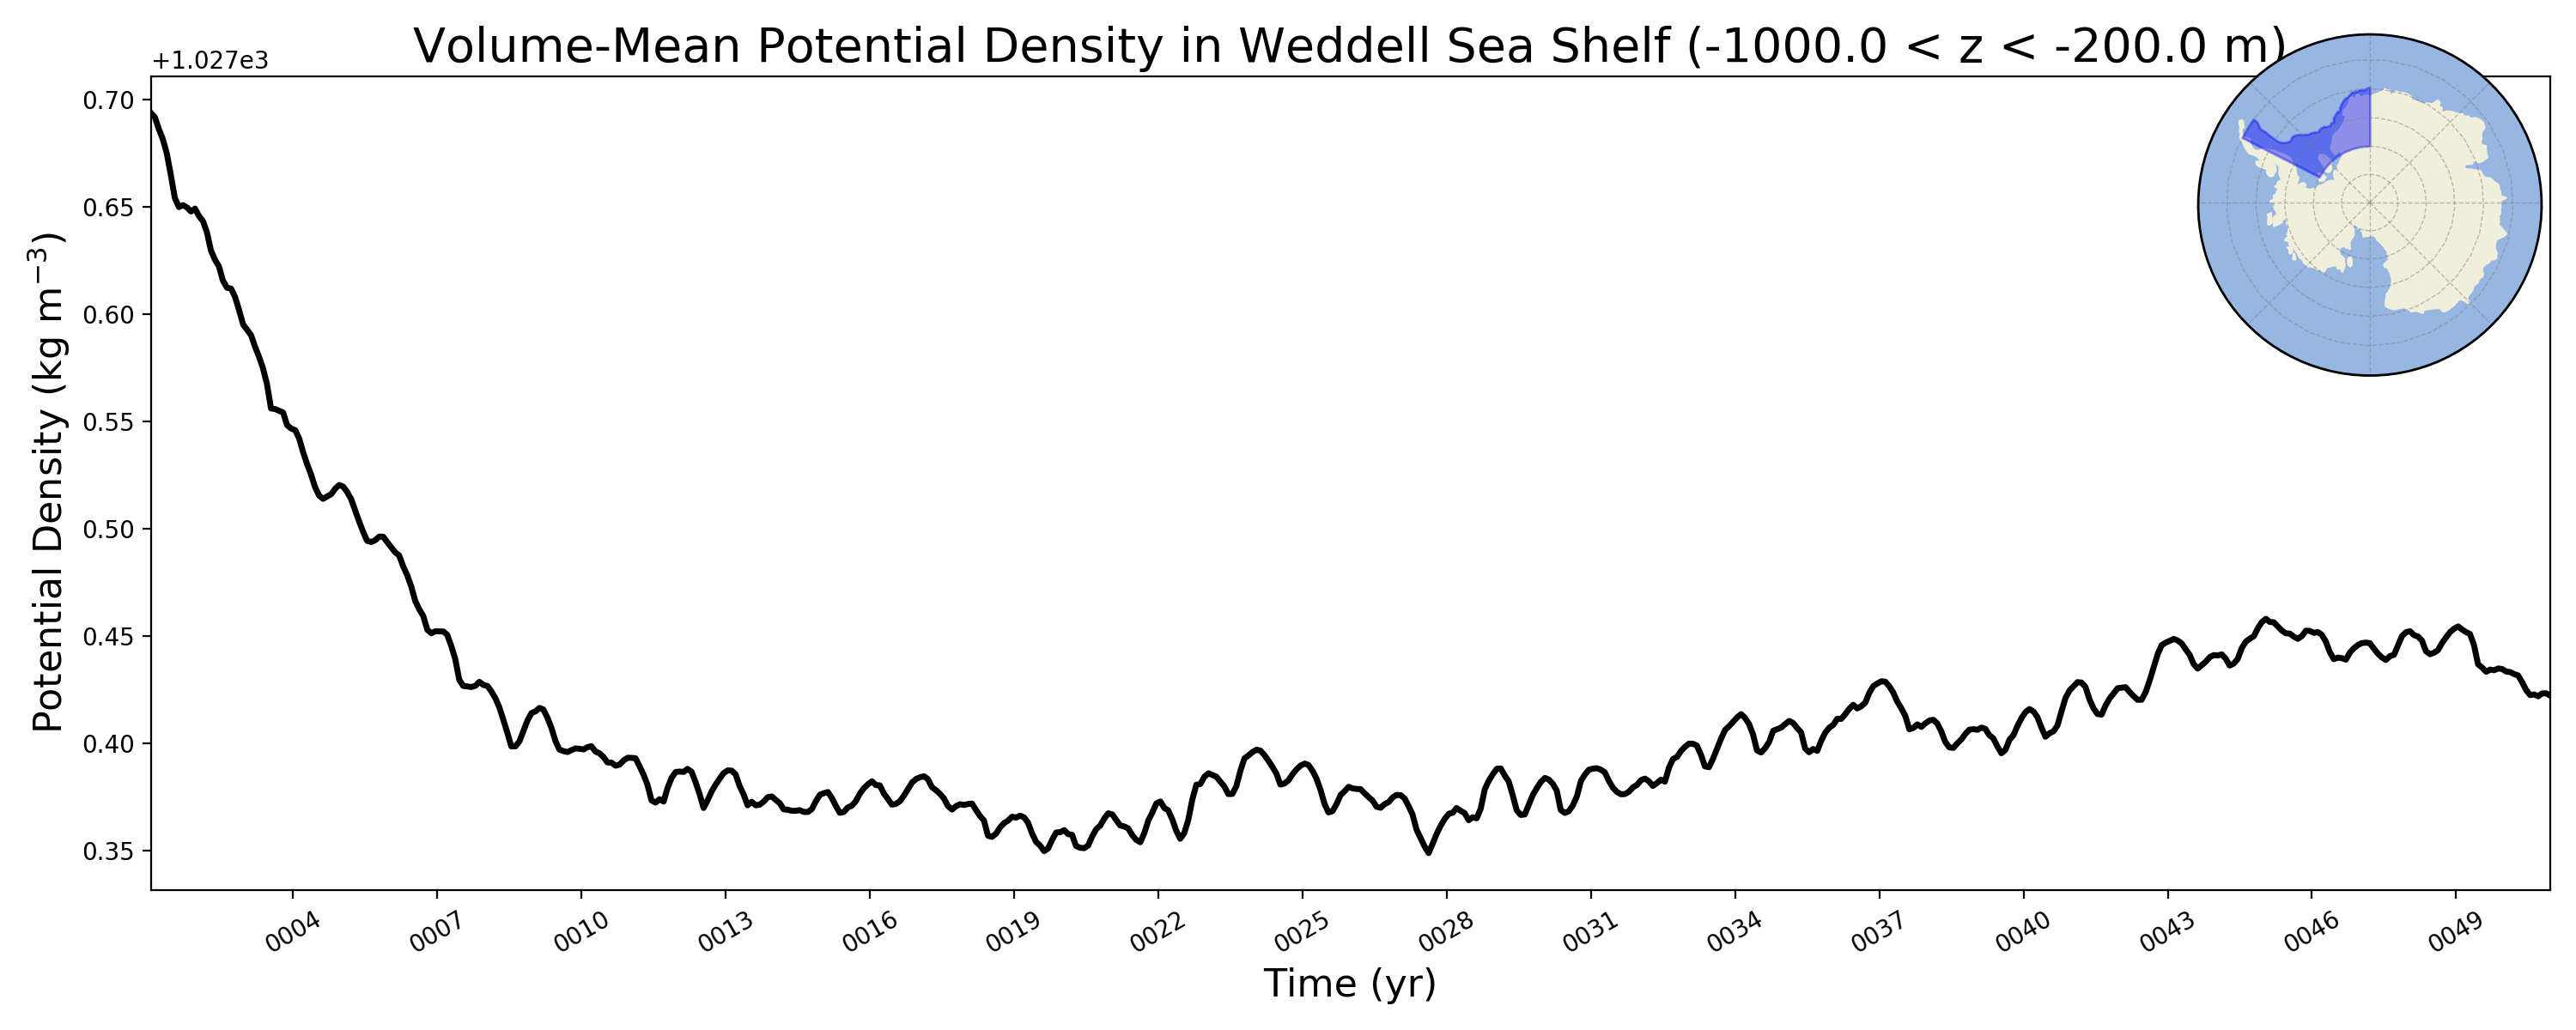
Weddell Sea Shelf
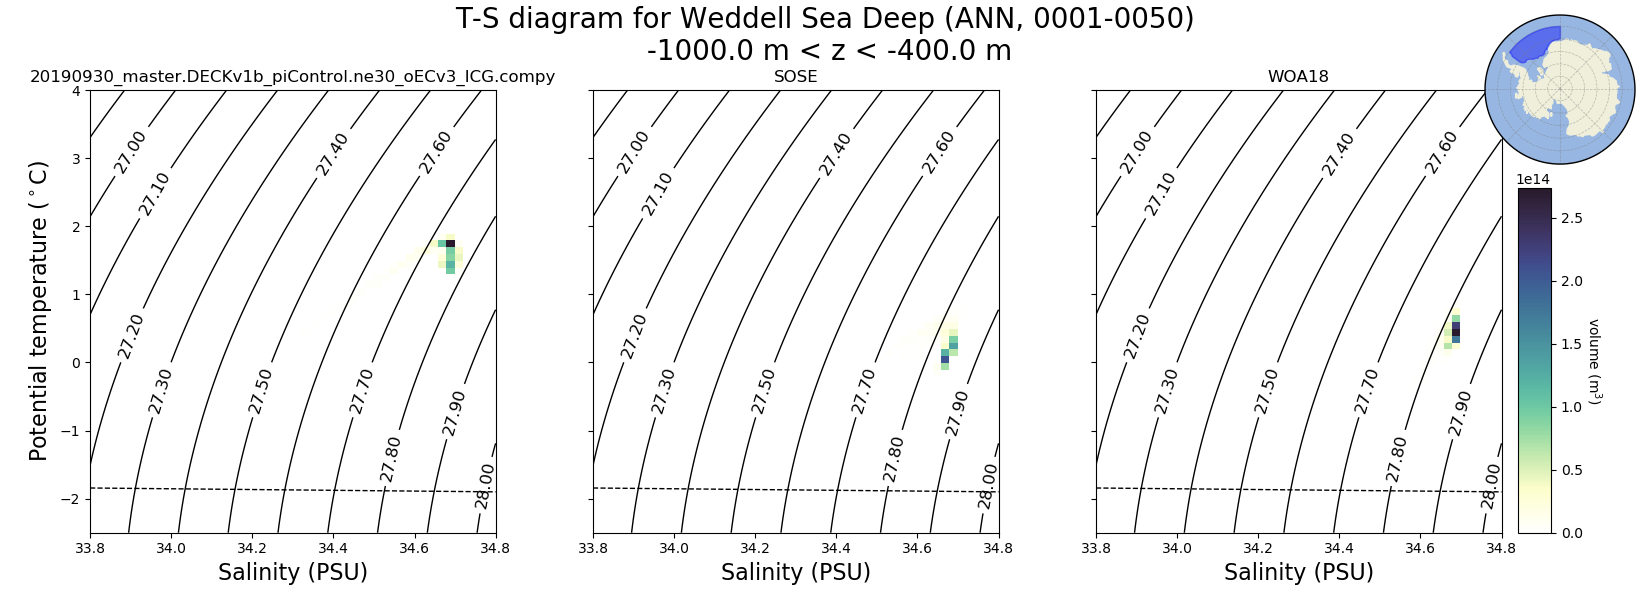
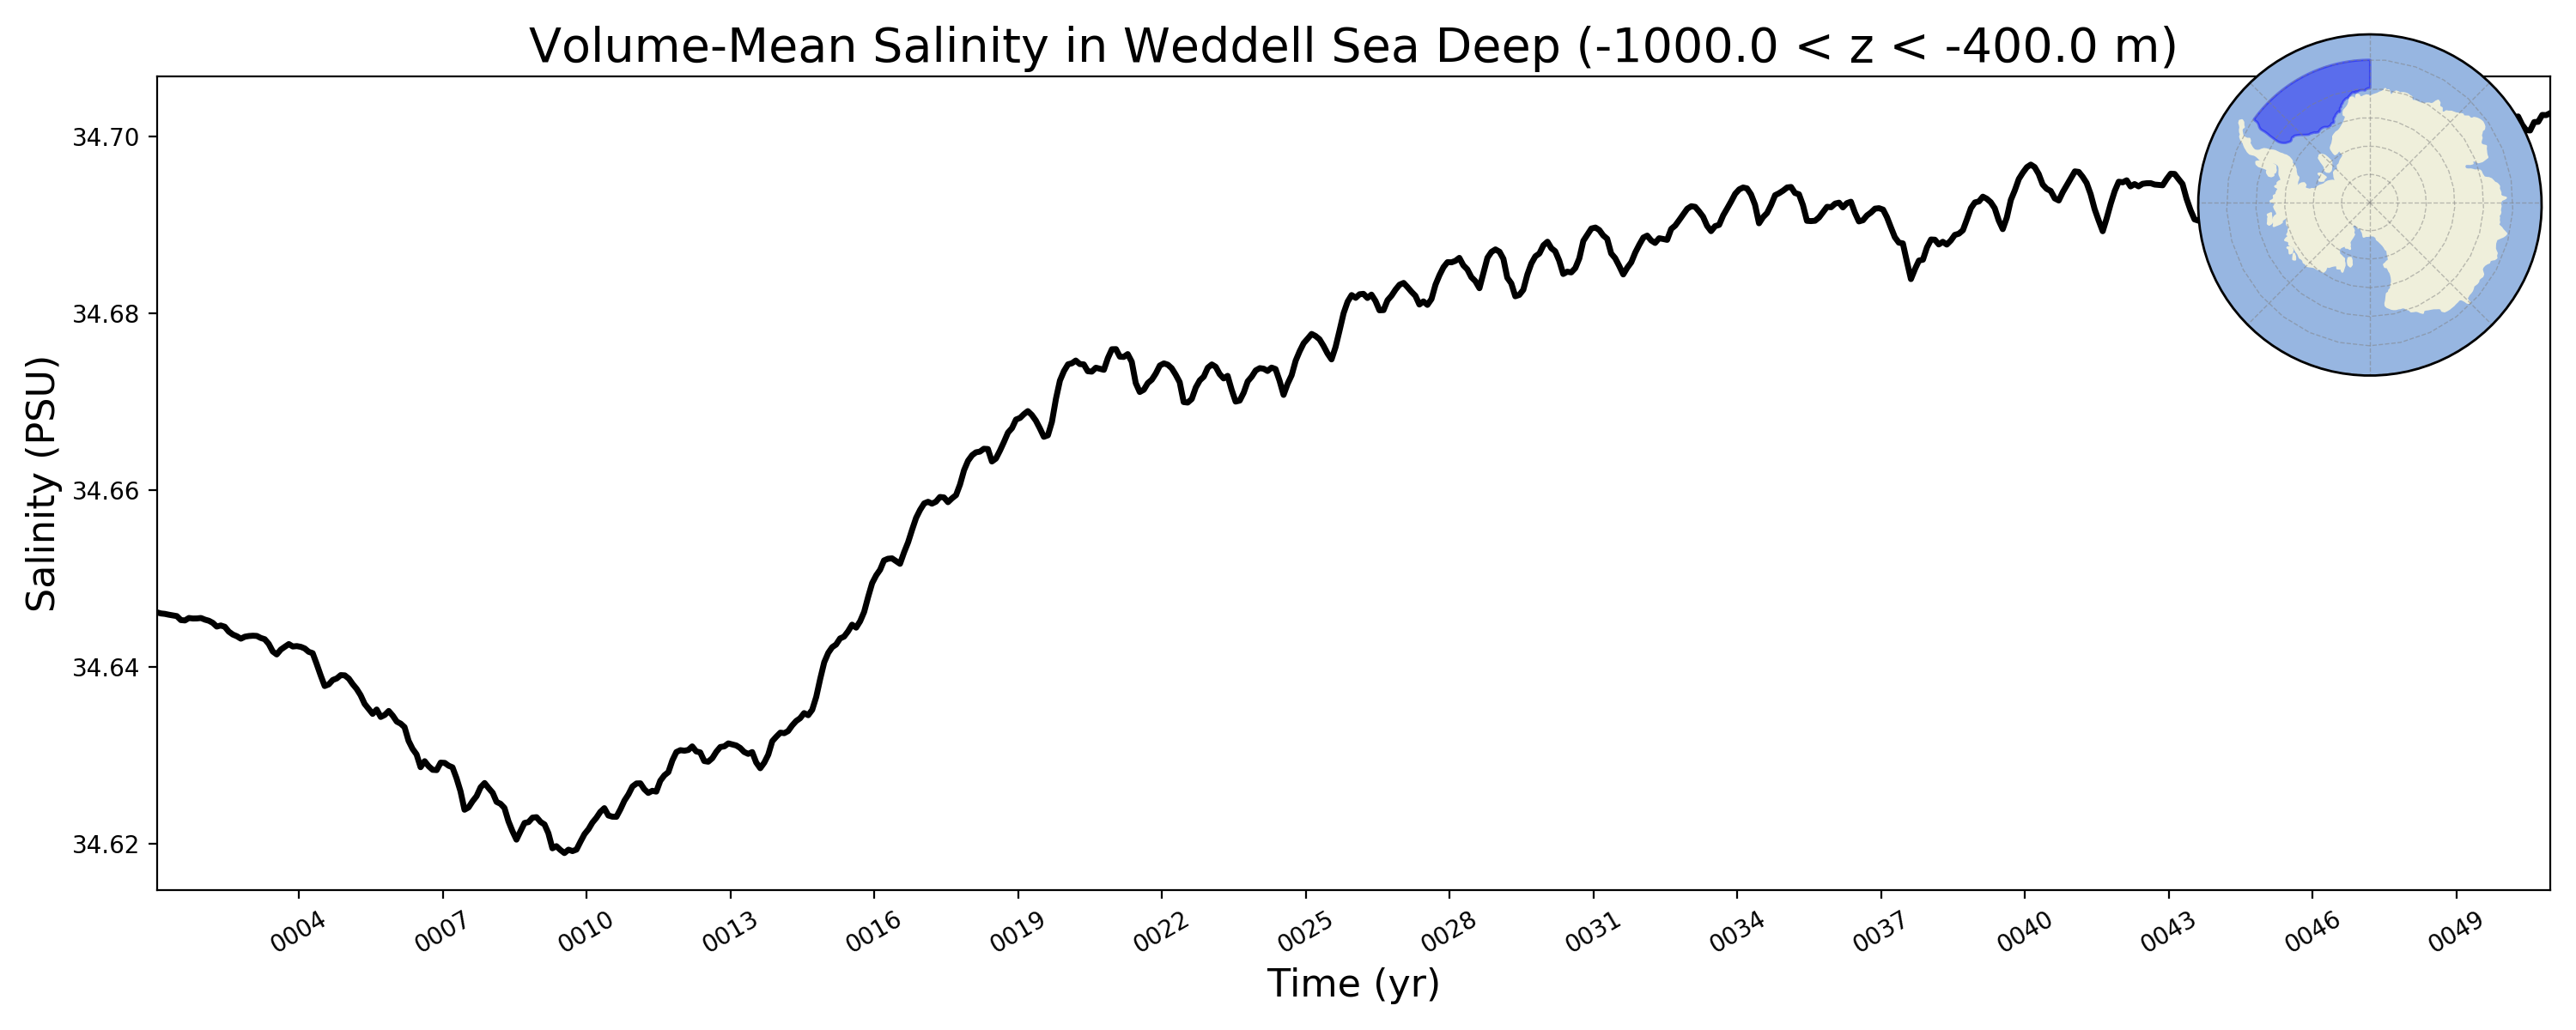
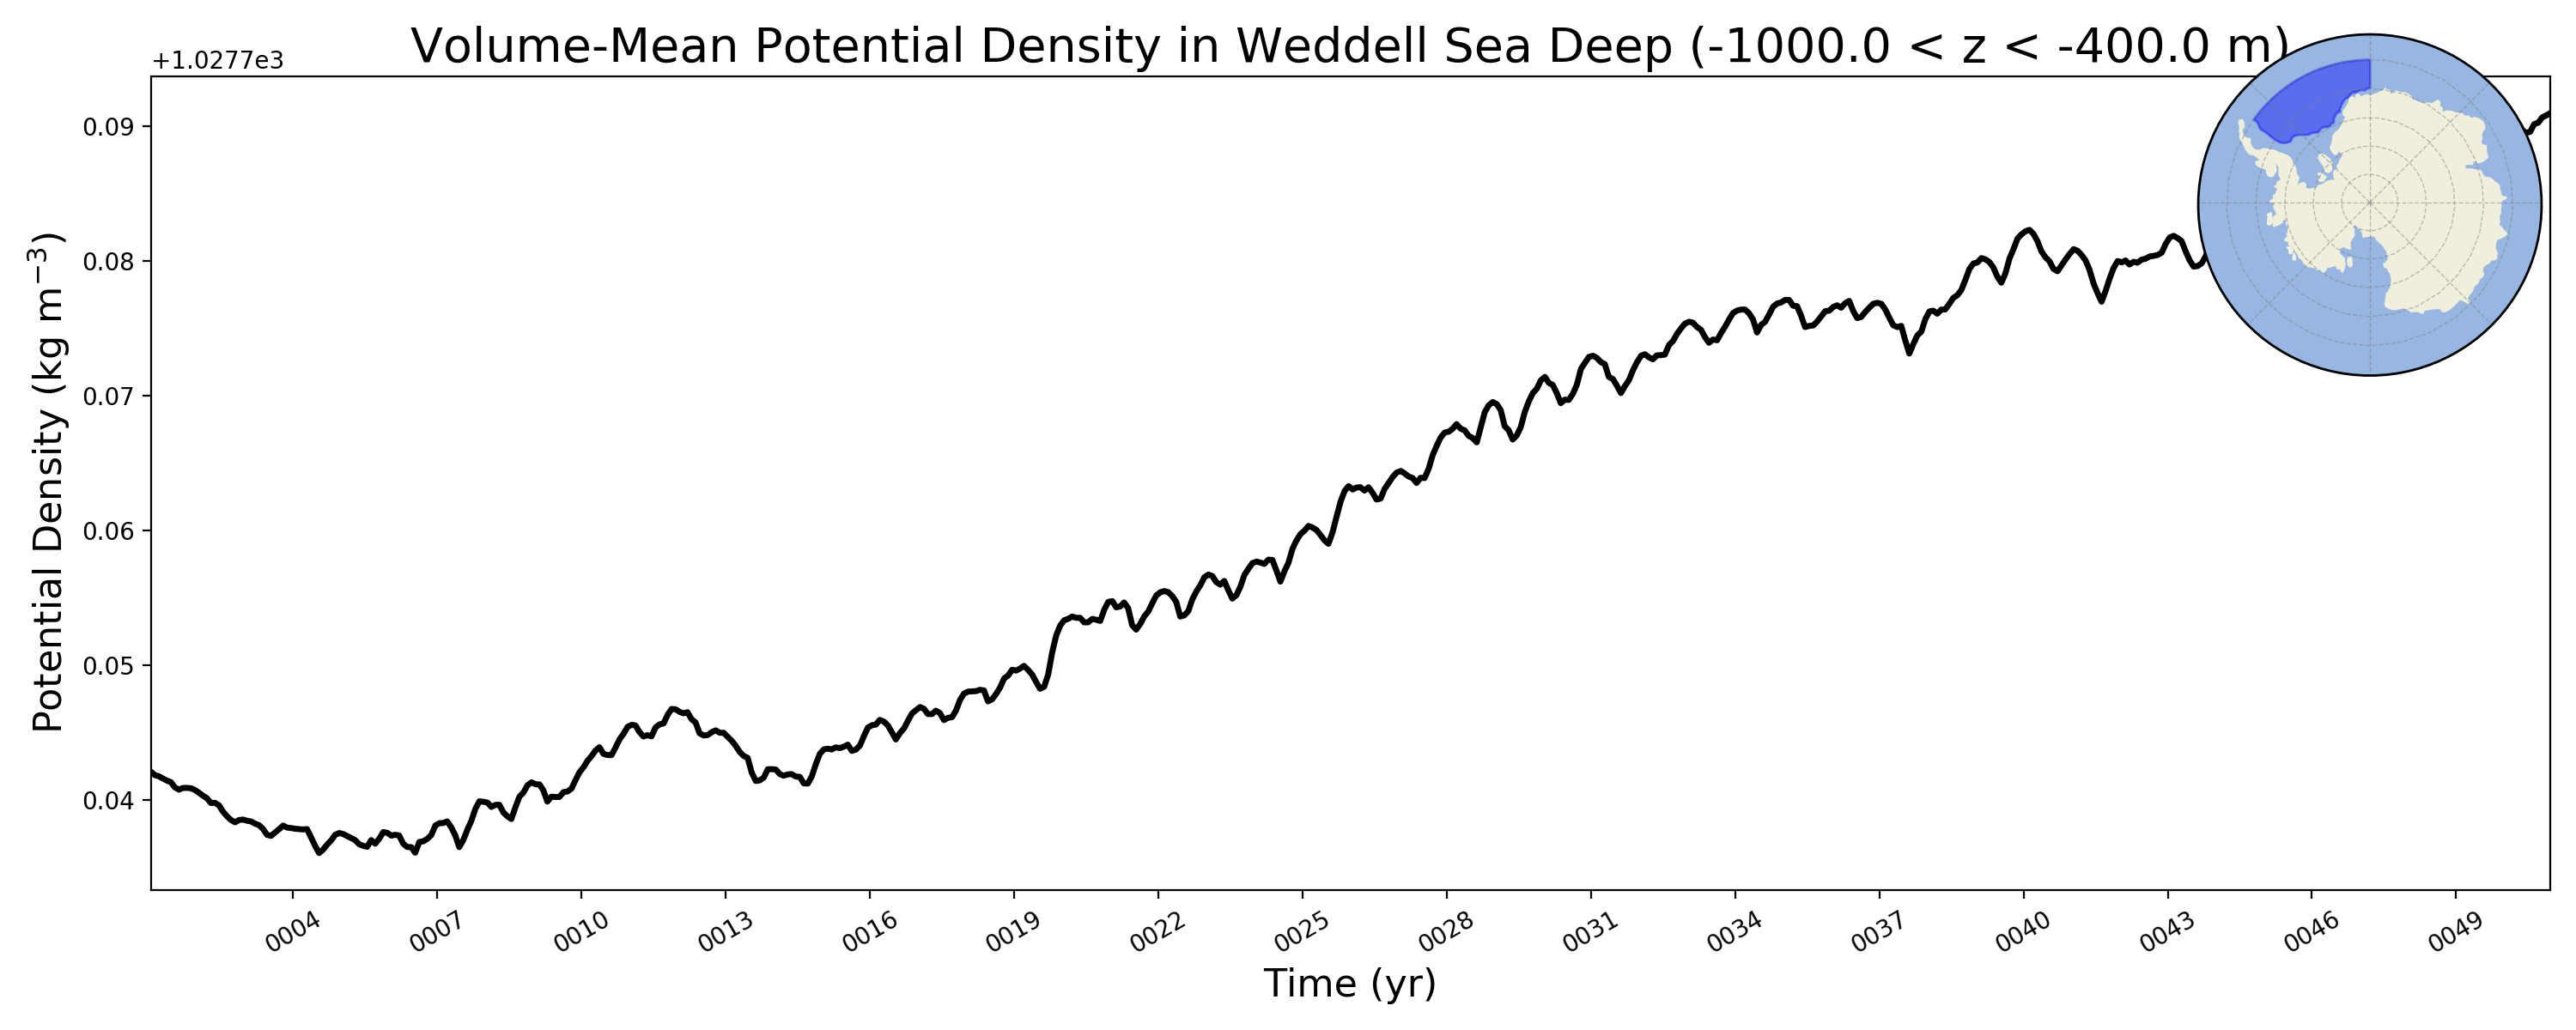
Weddell Sea Deep
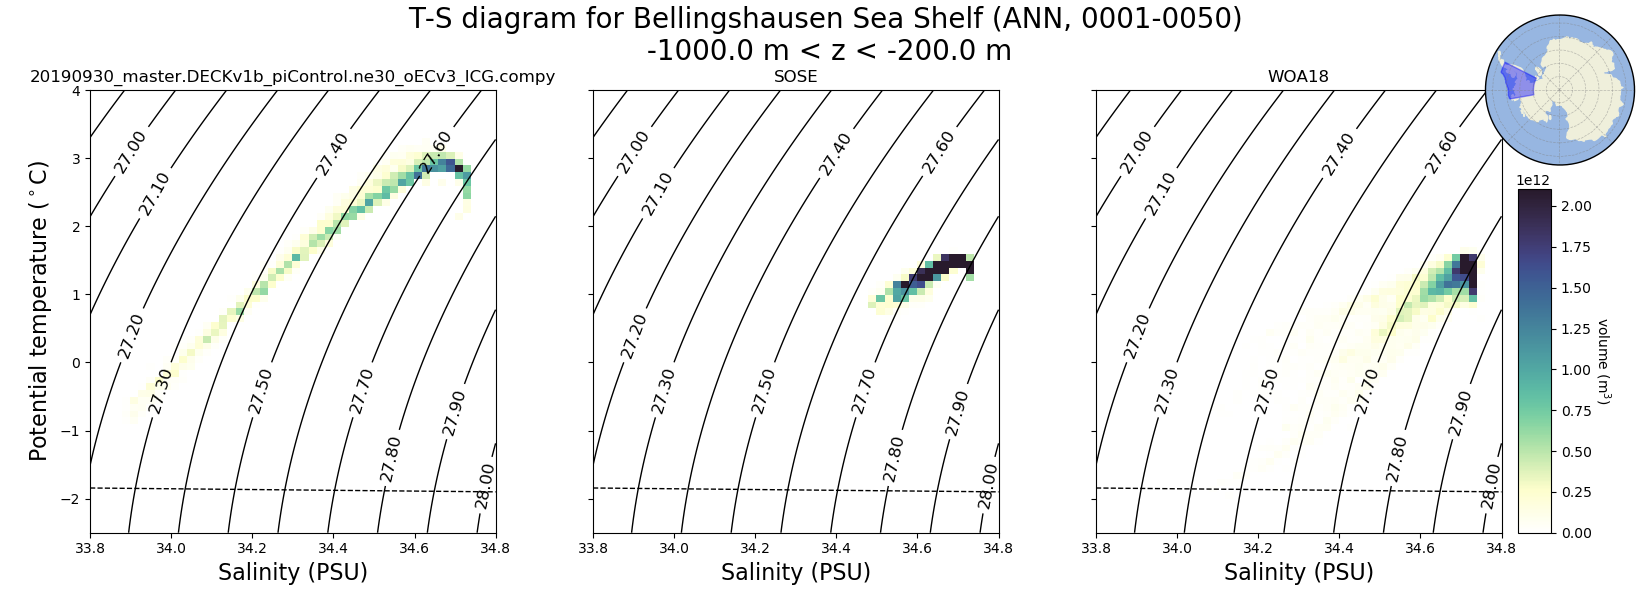
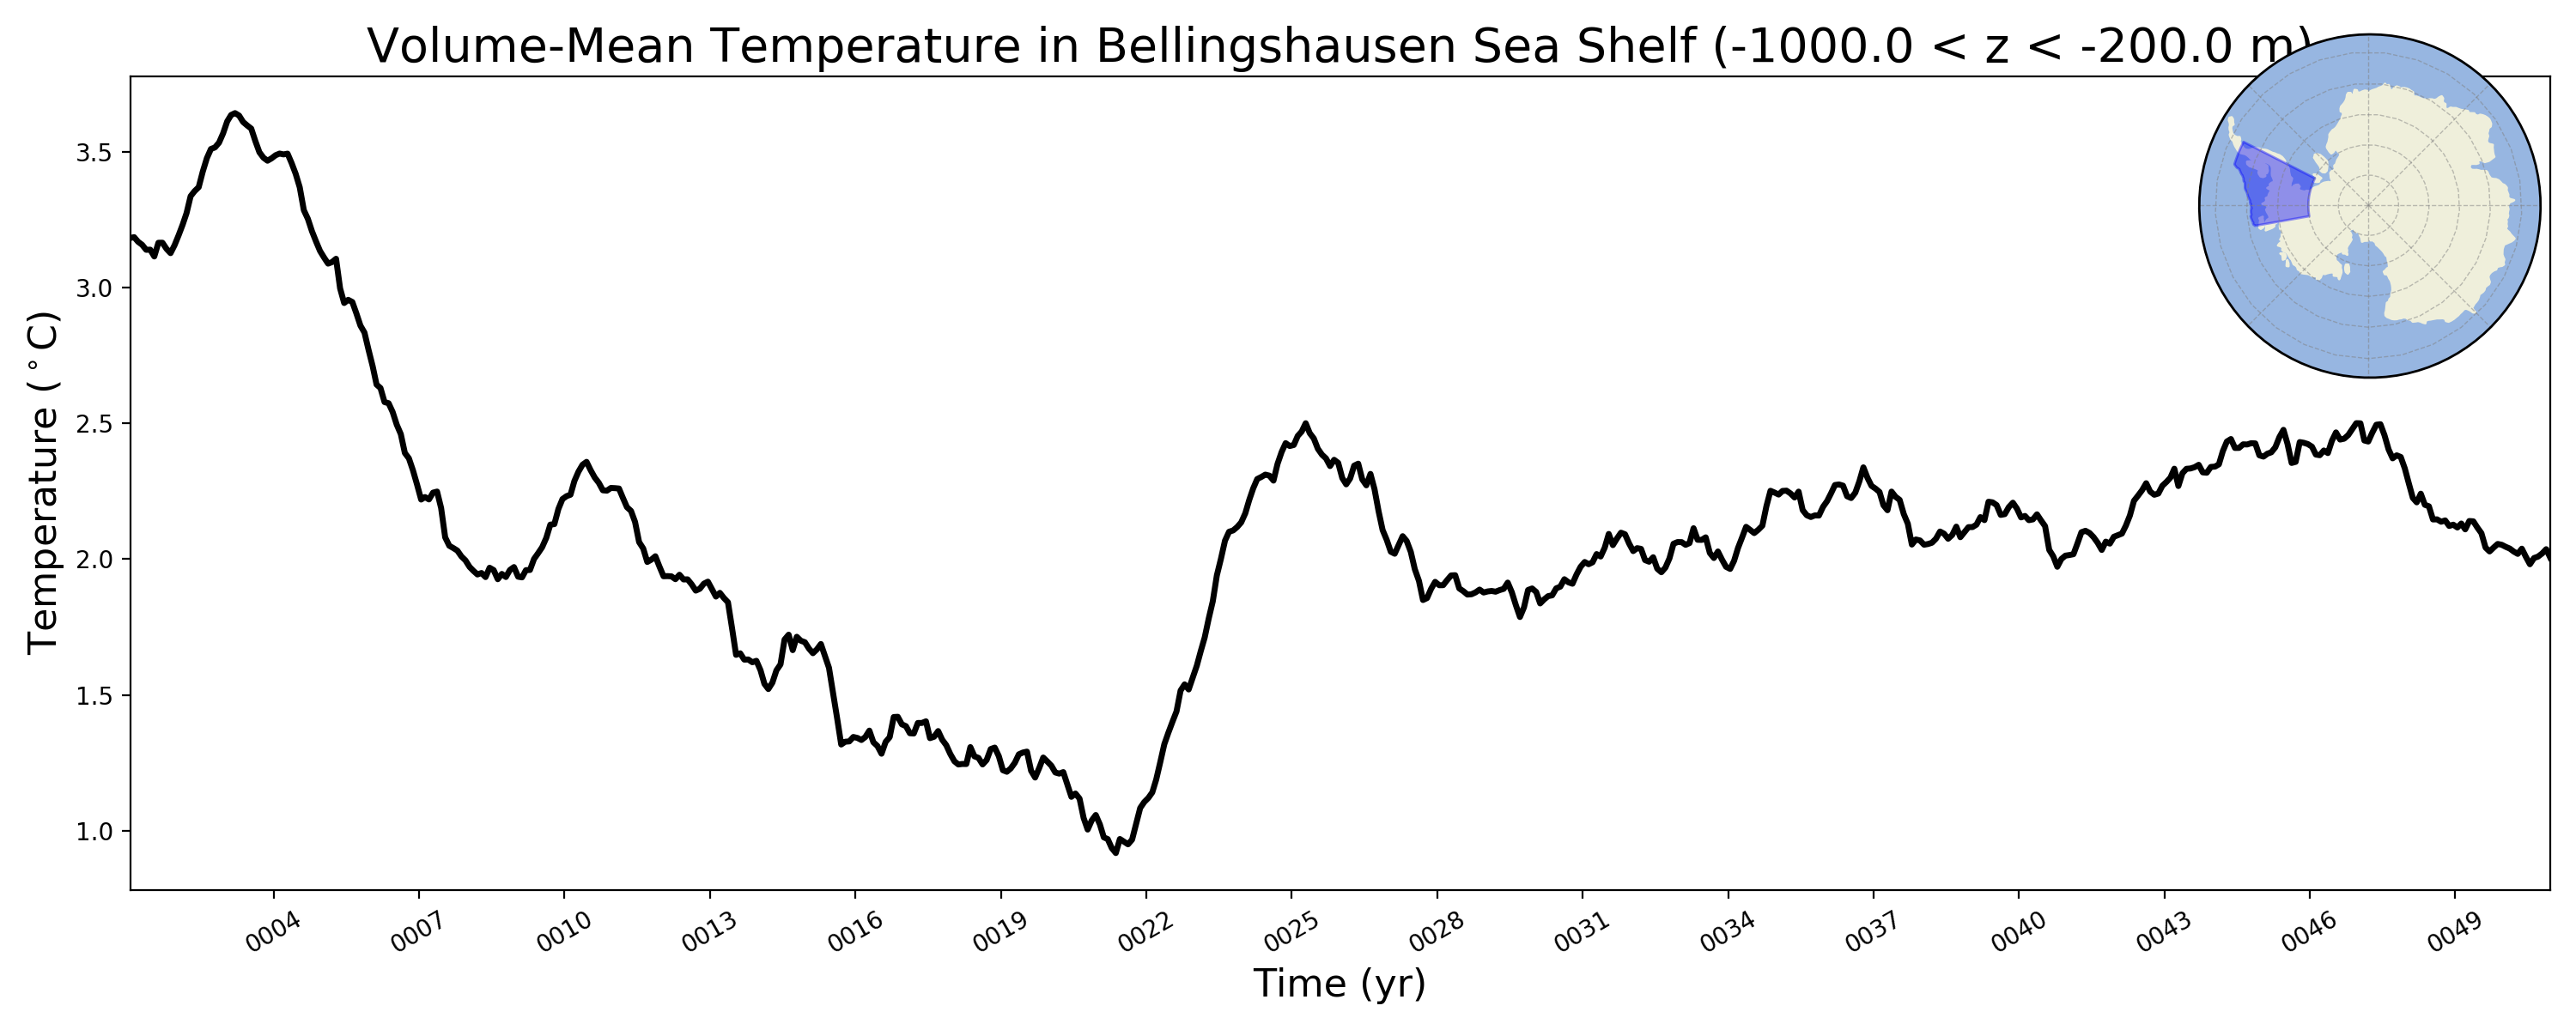
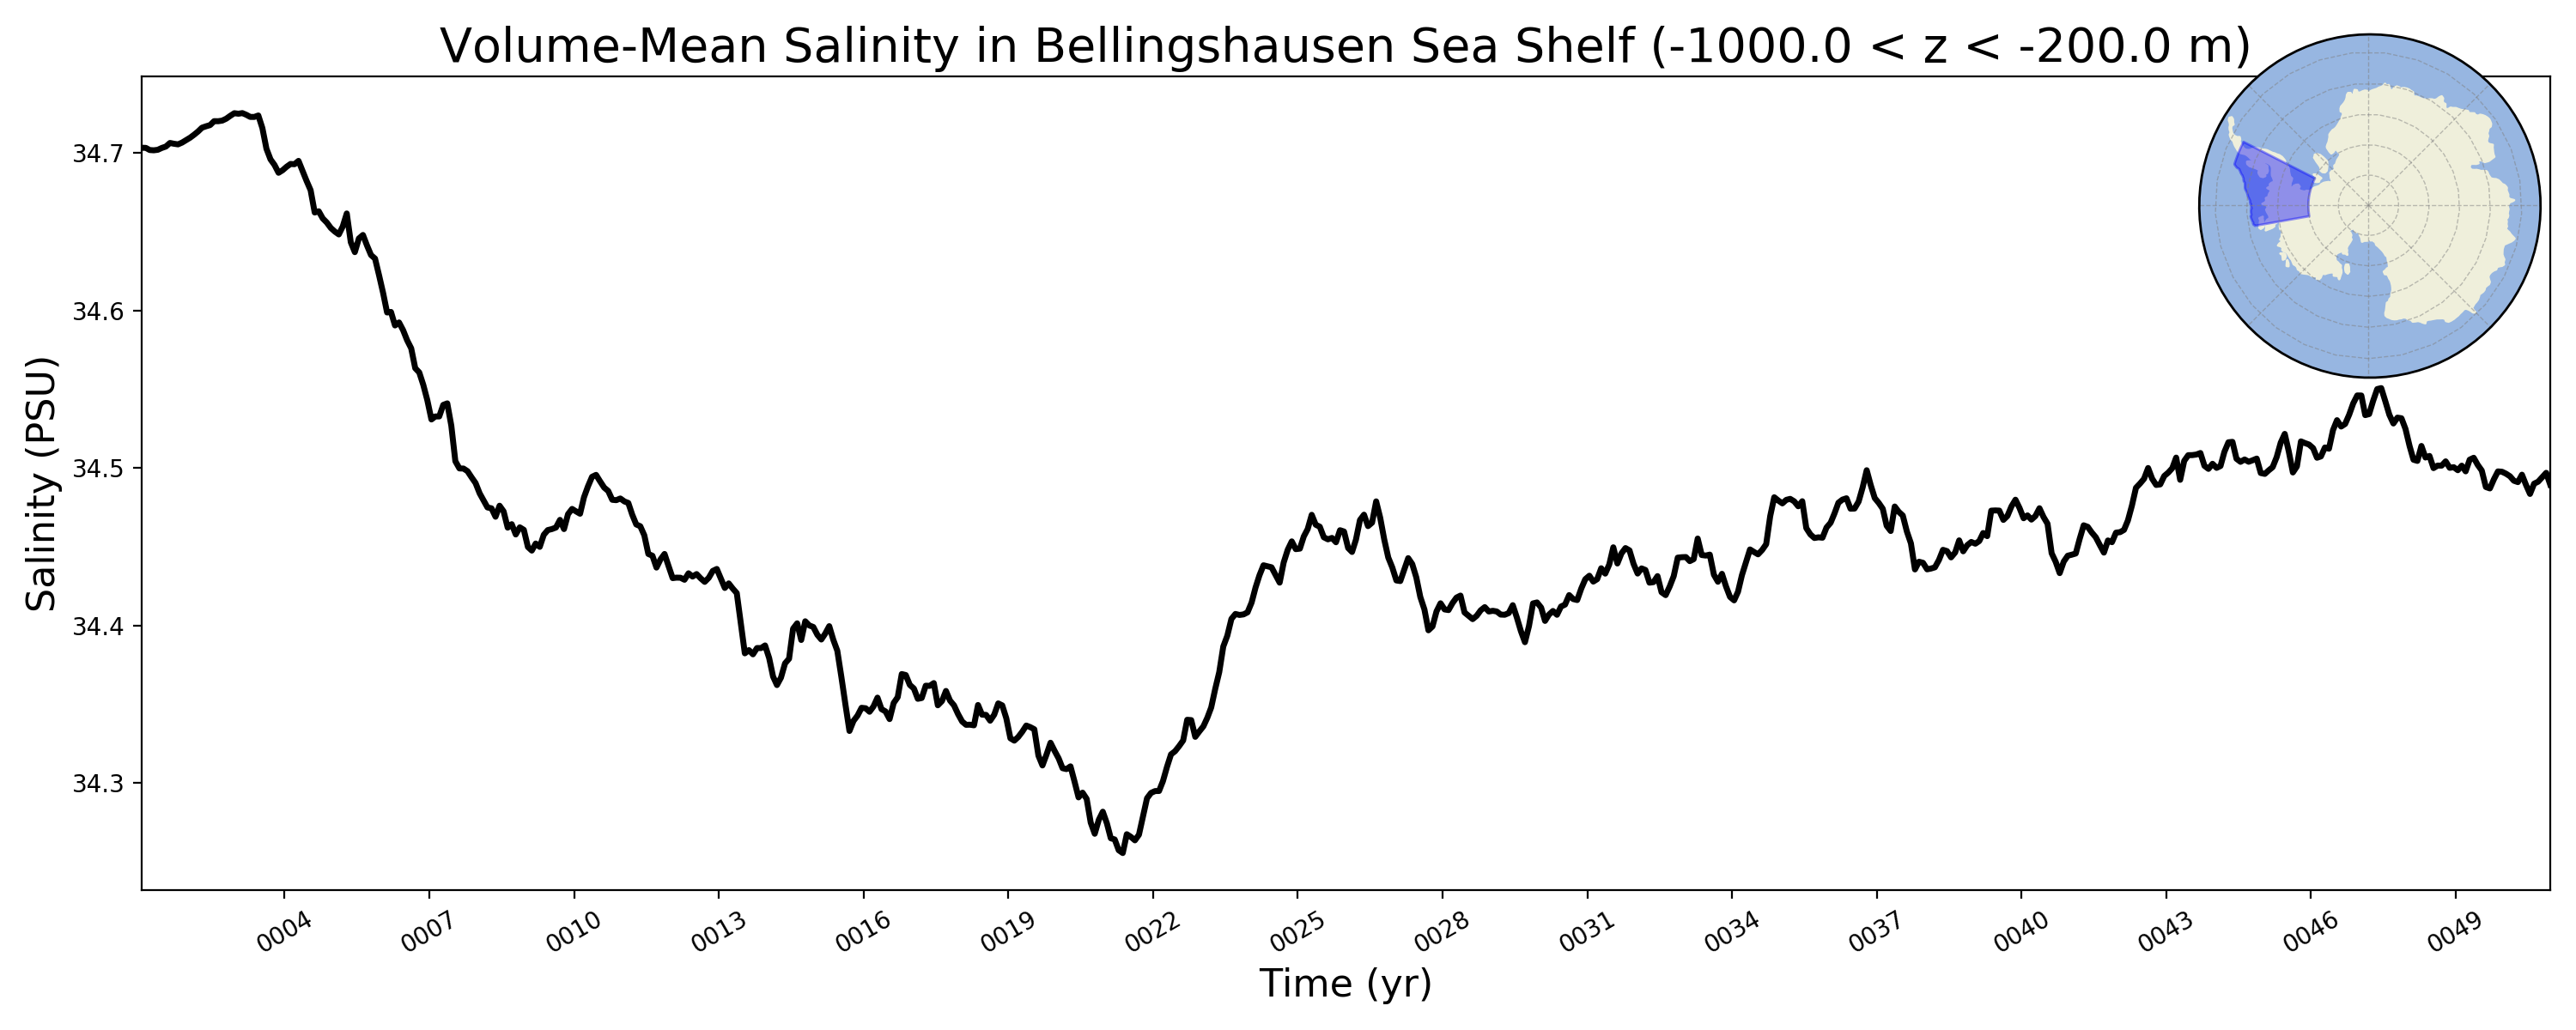
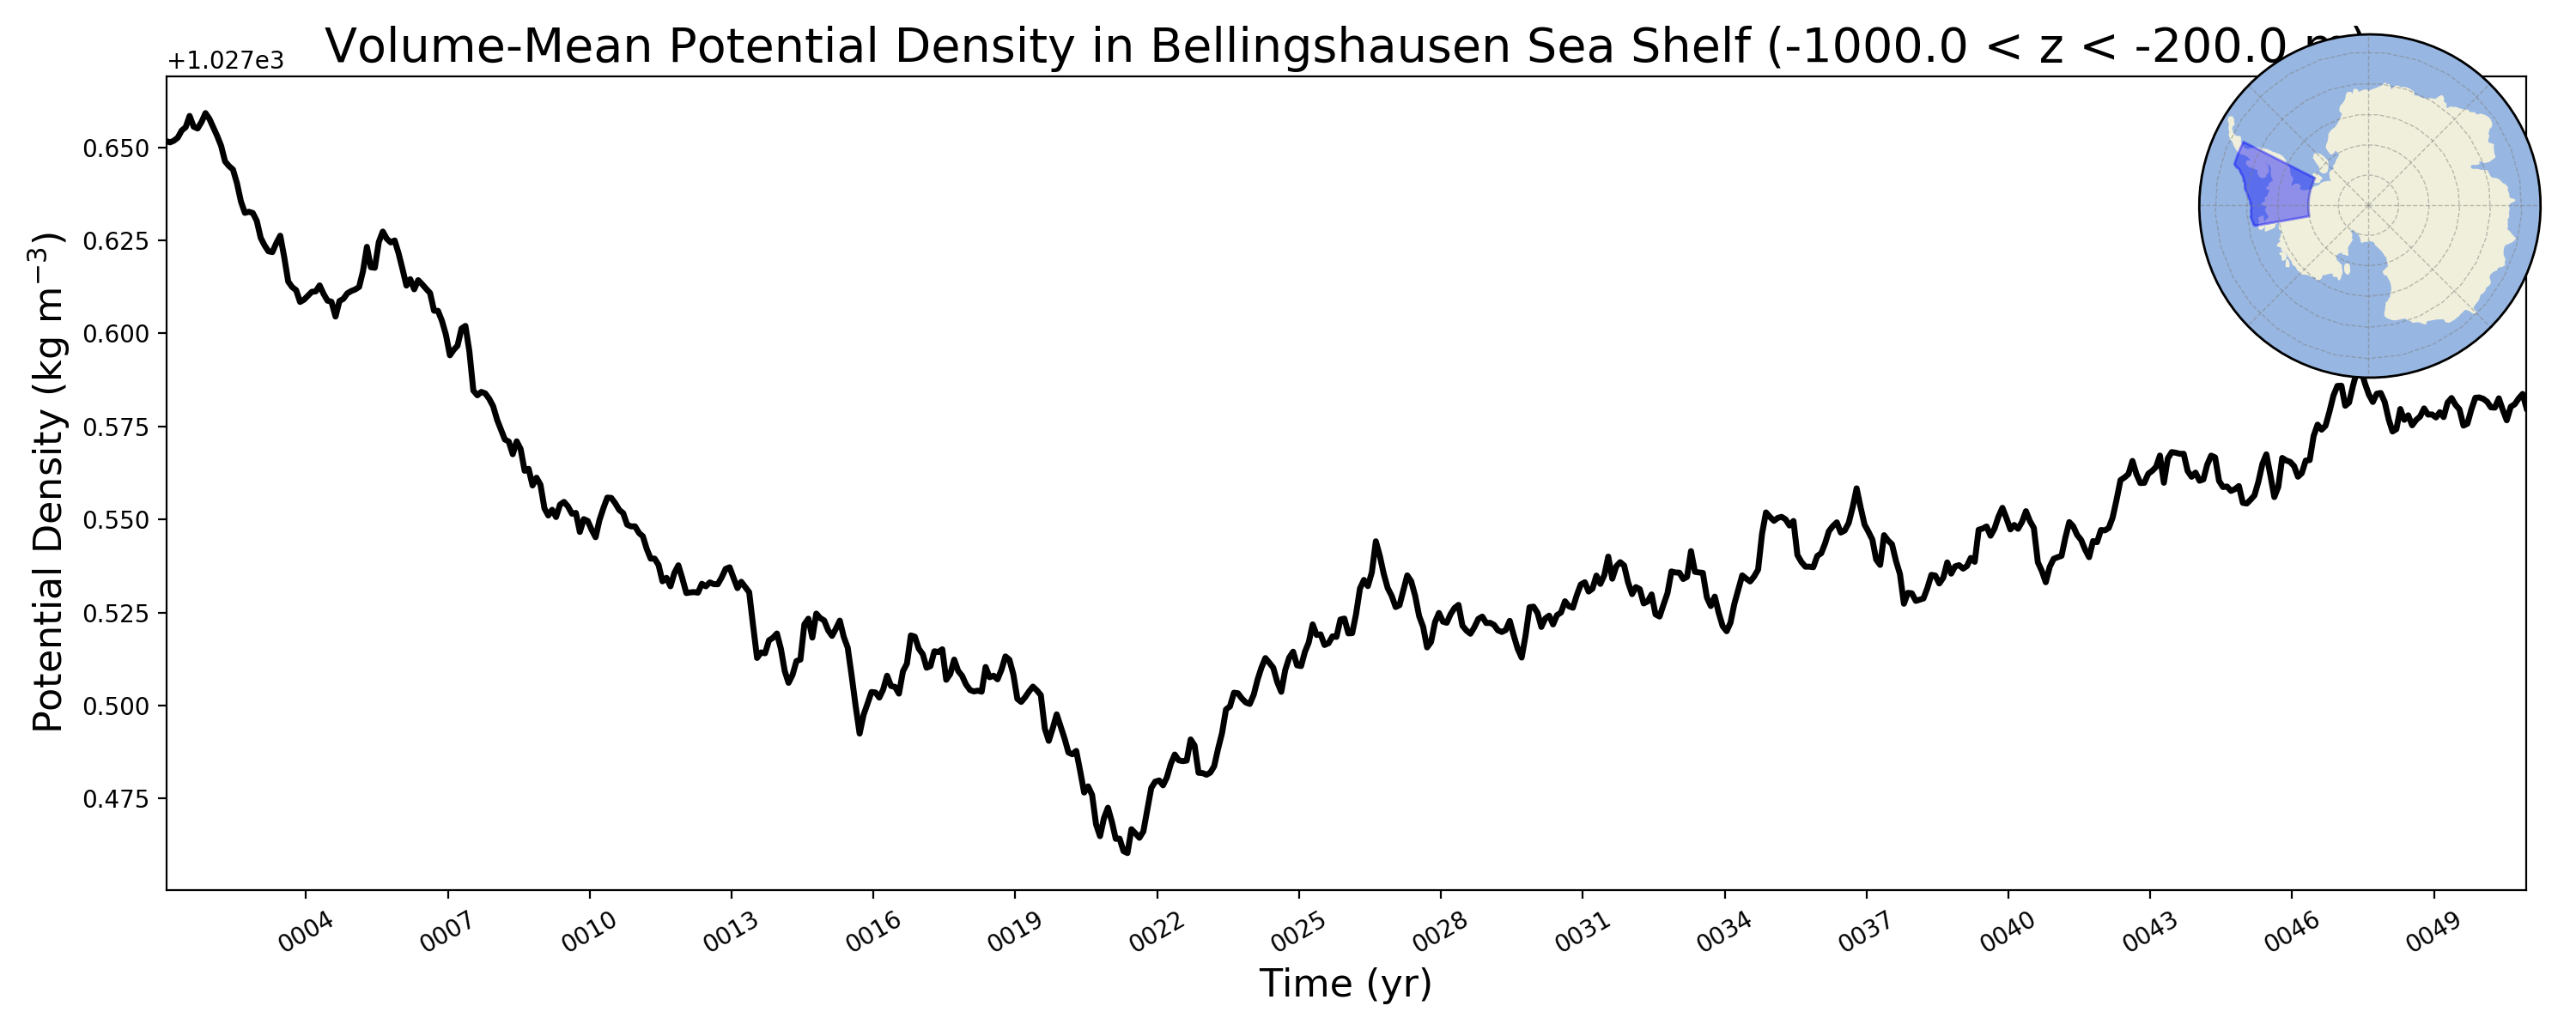
Bellingshausen Sea Shelf
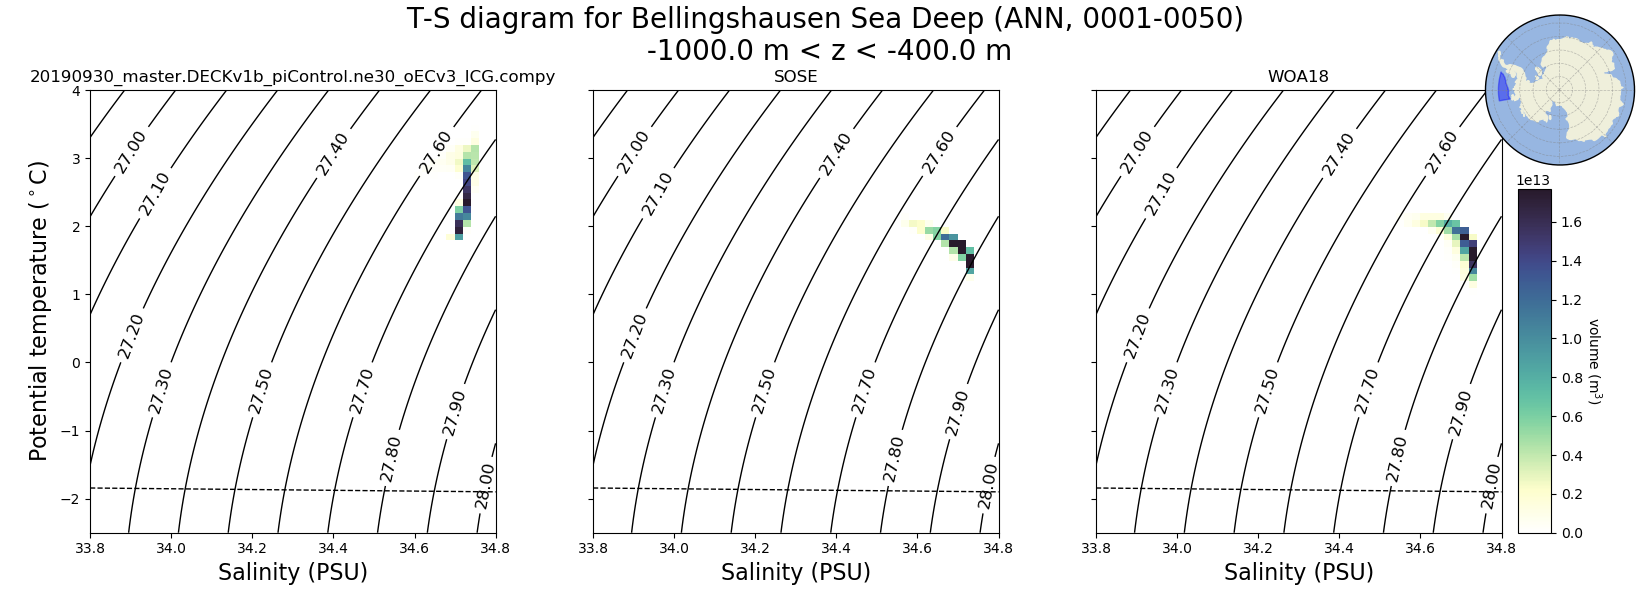
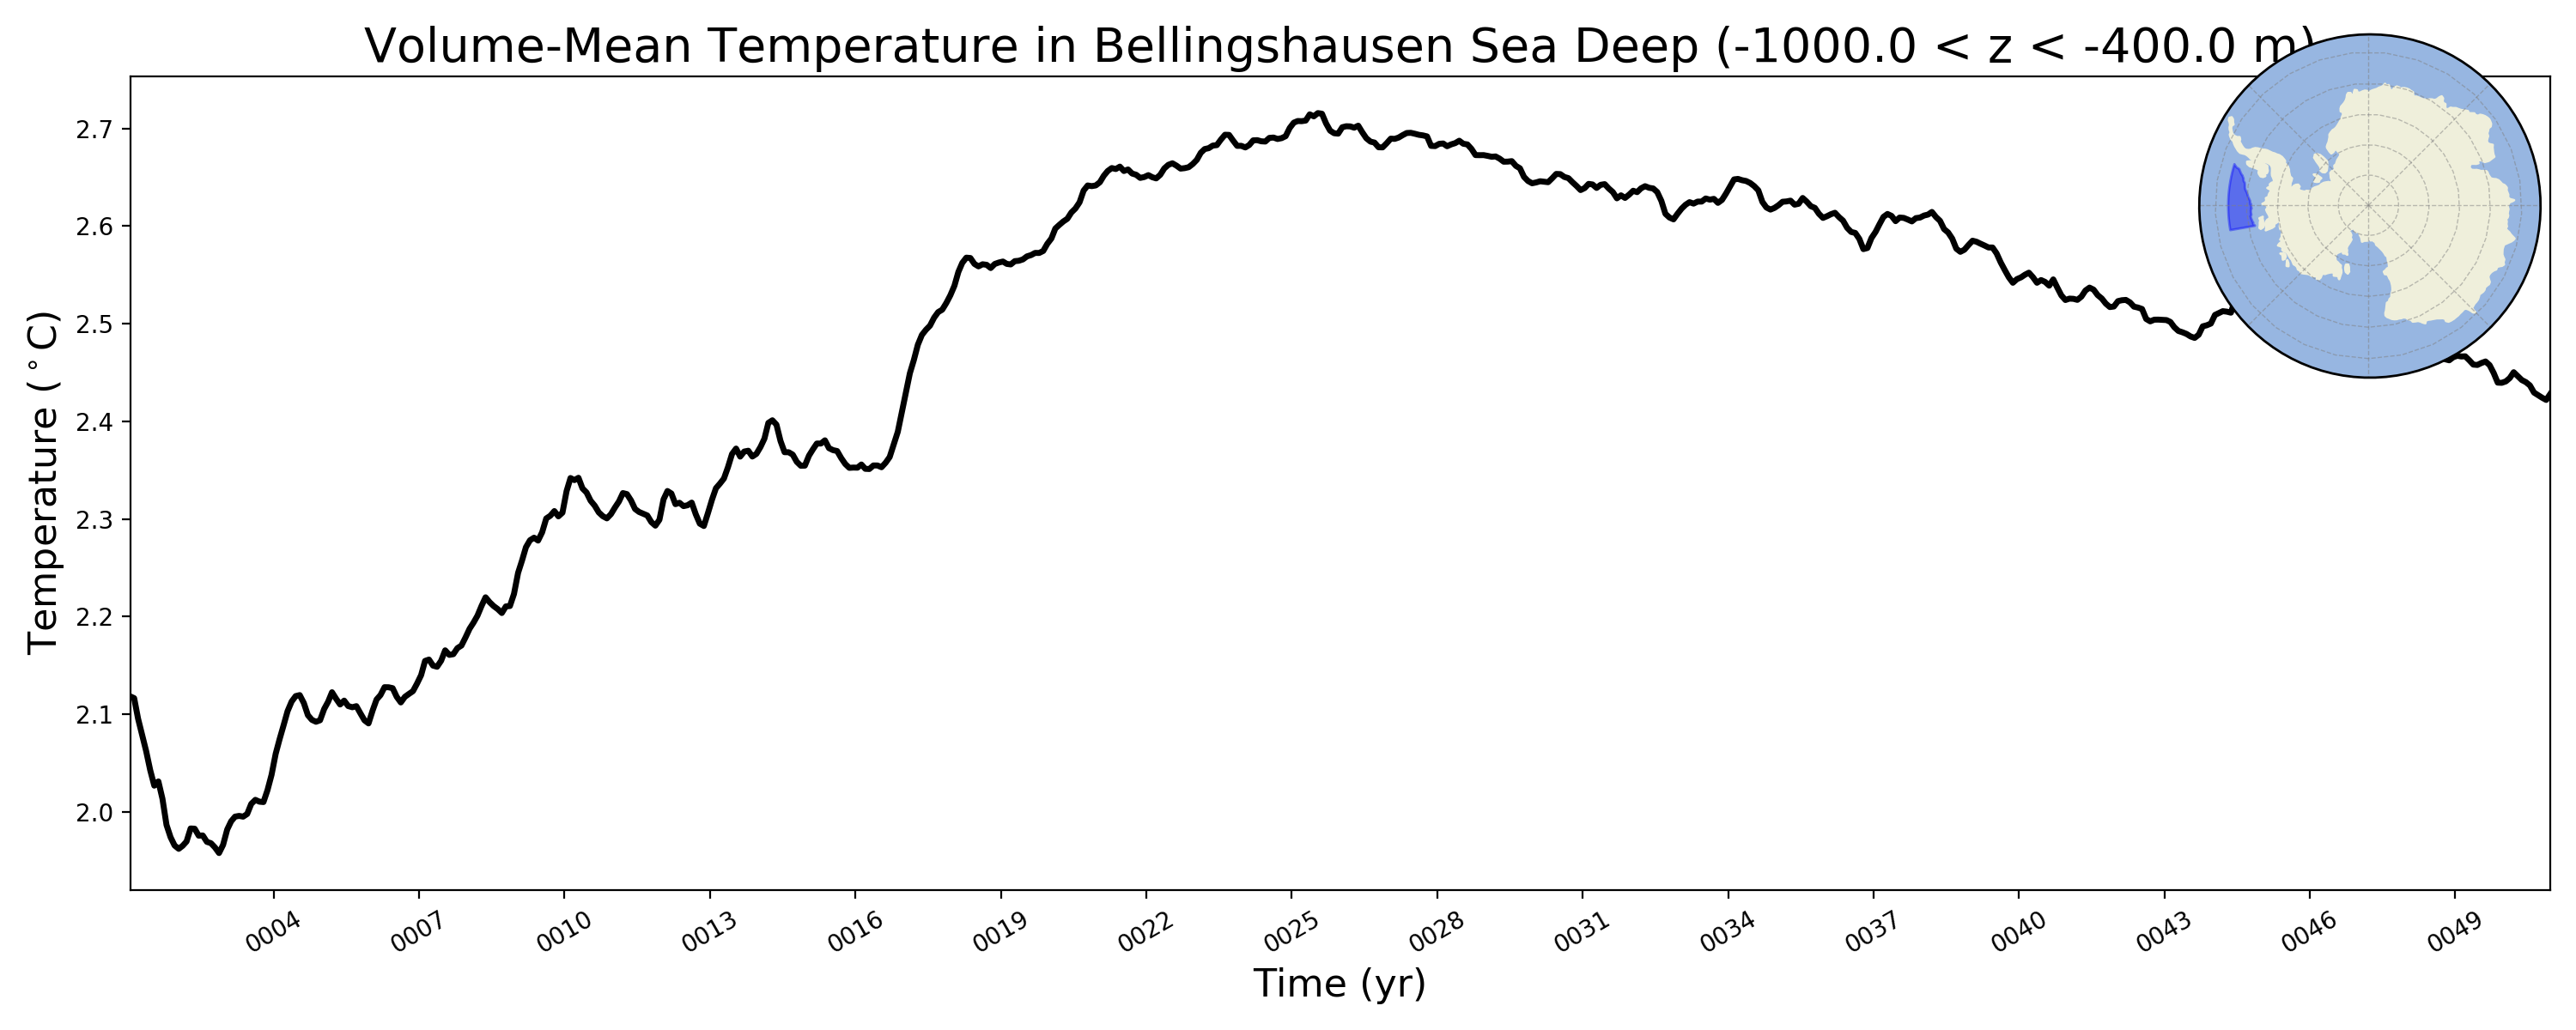
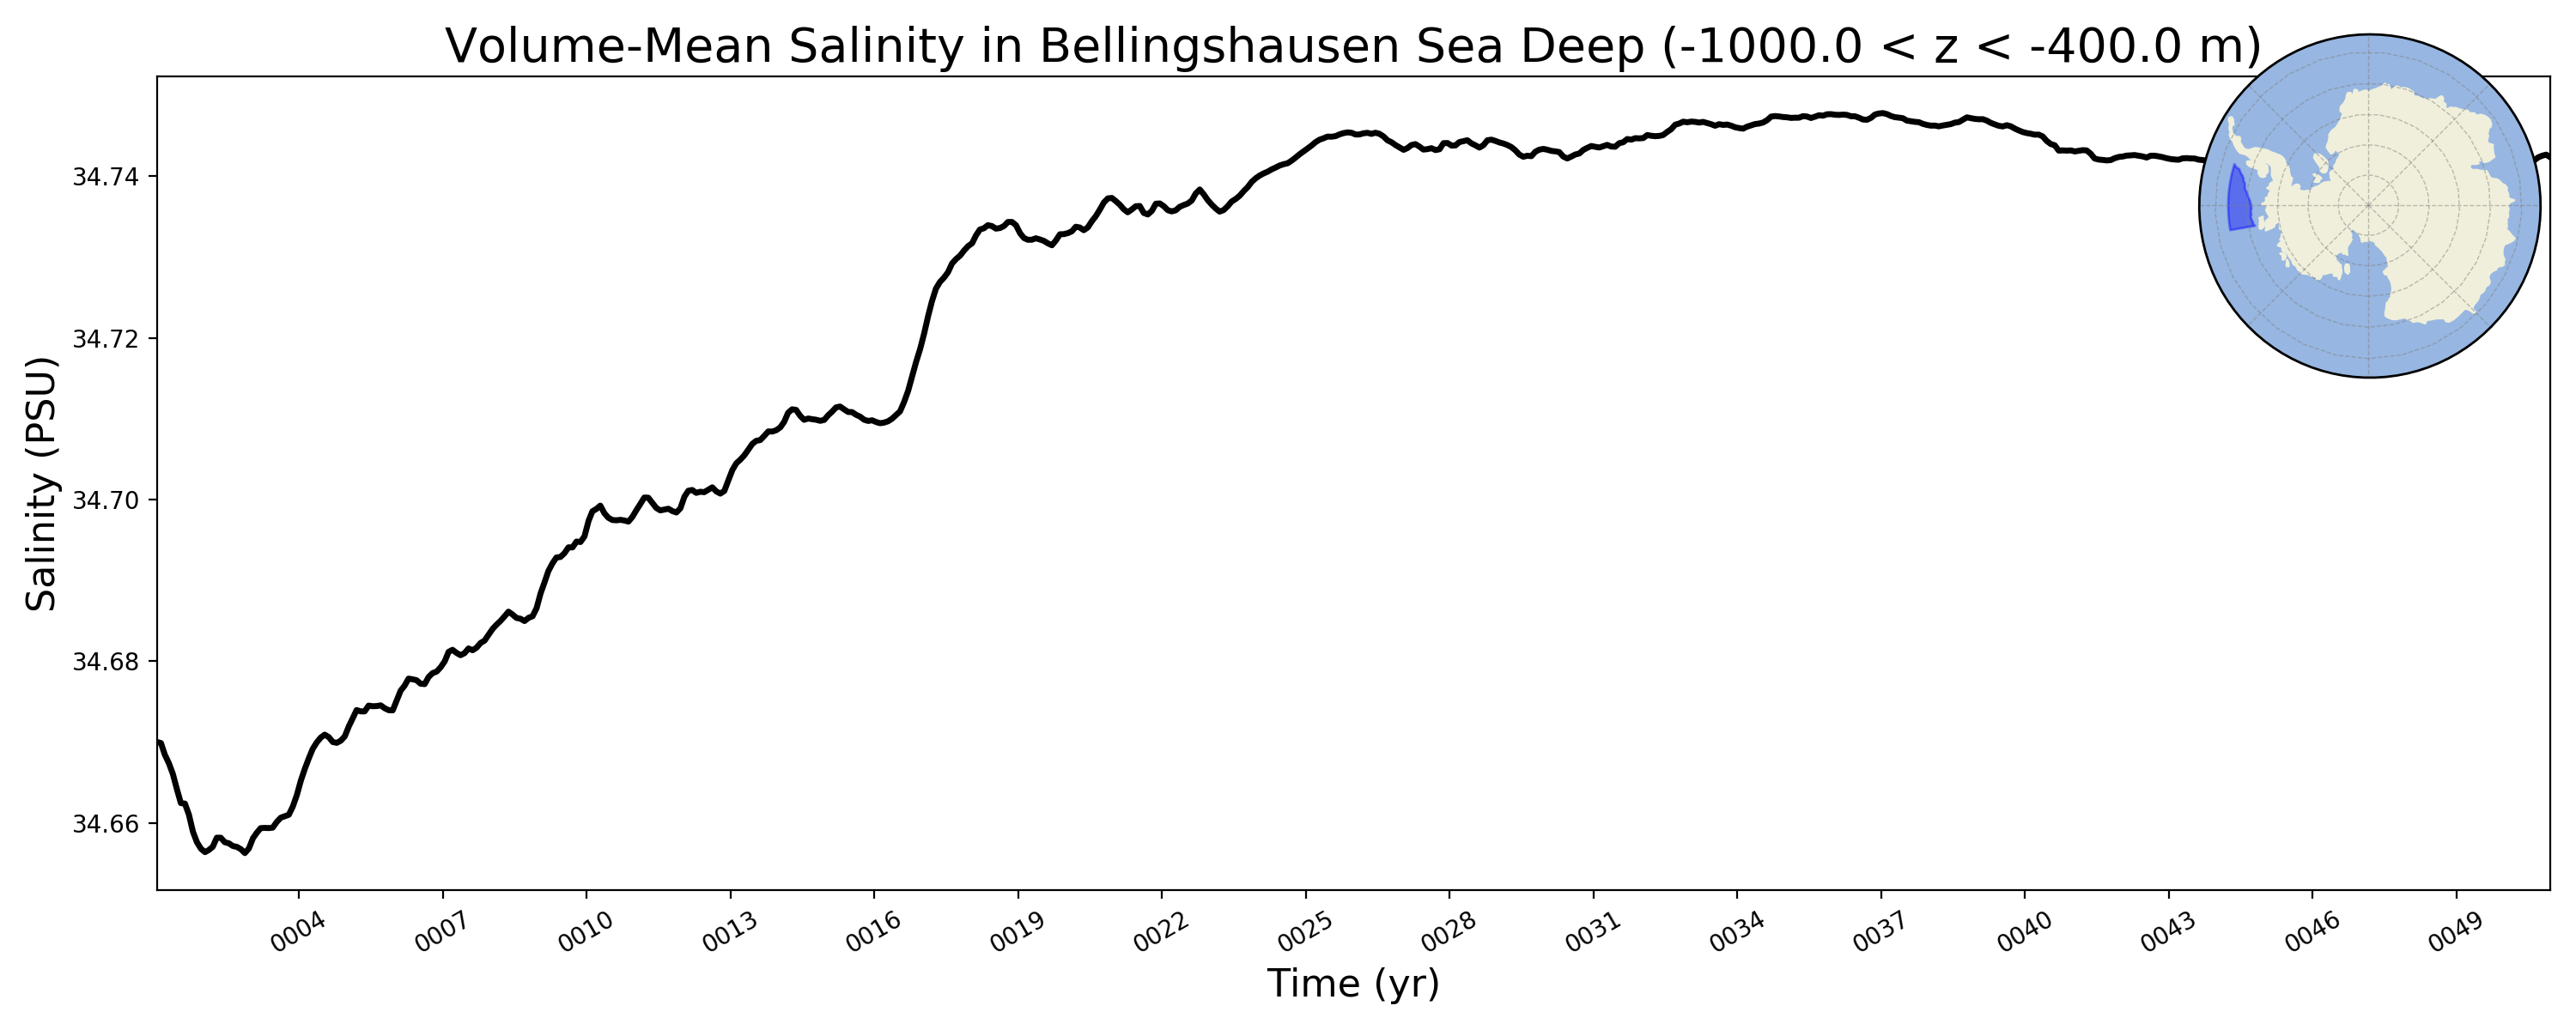
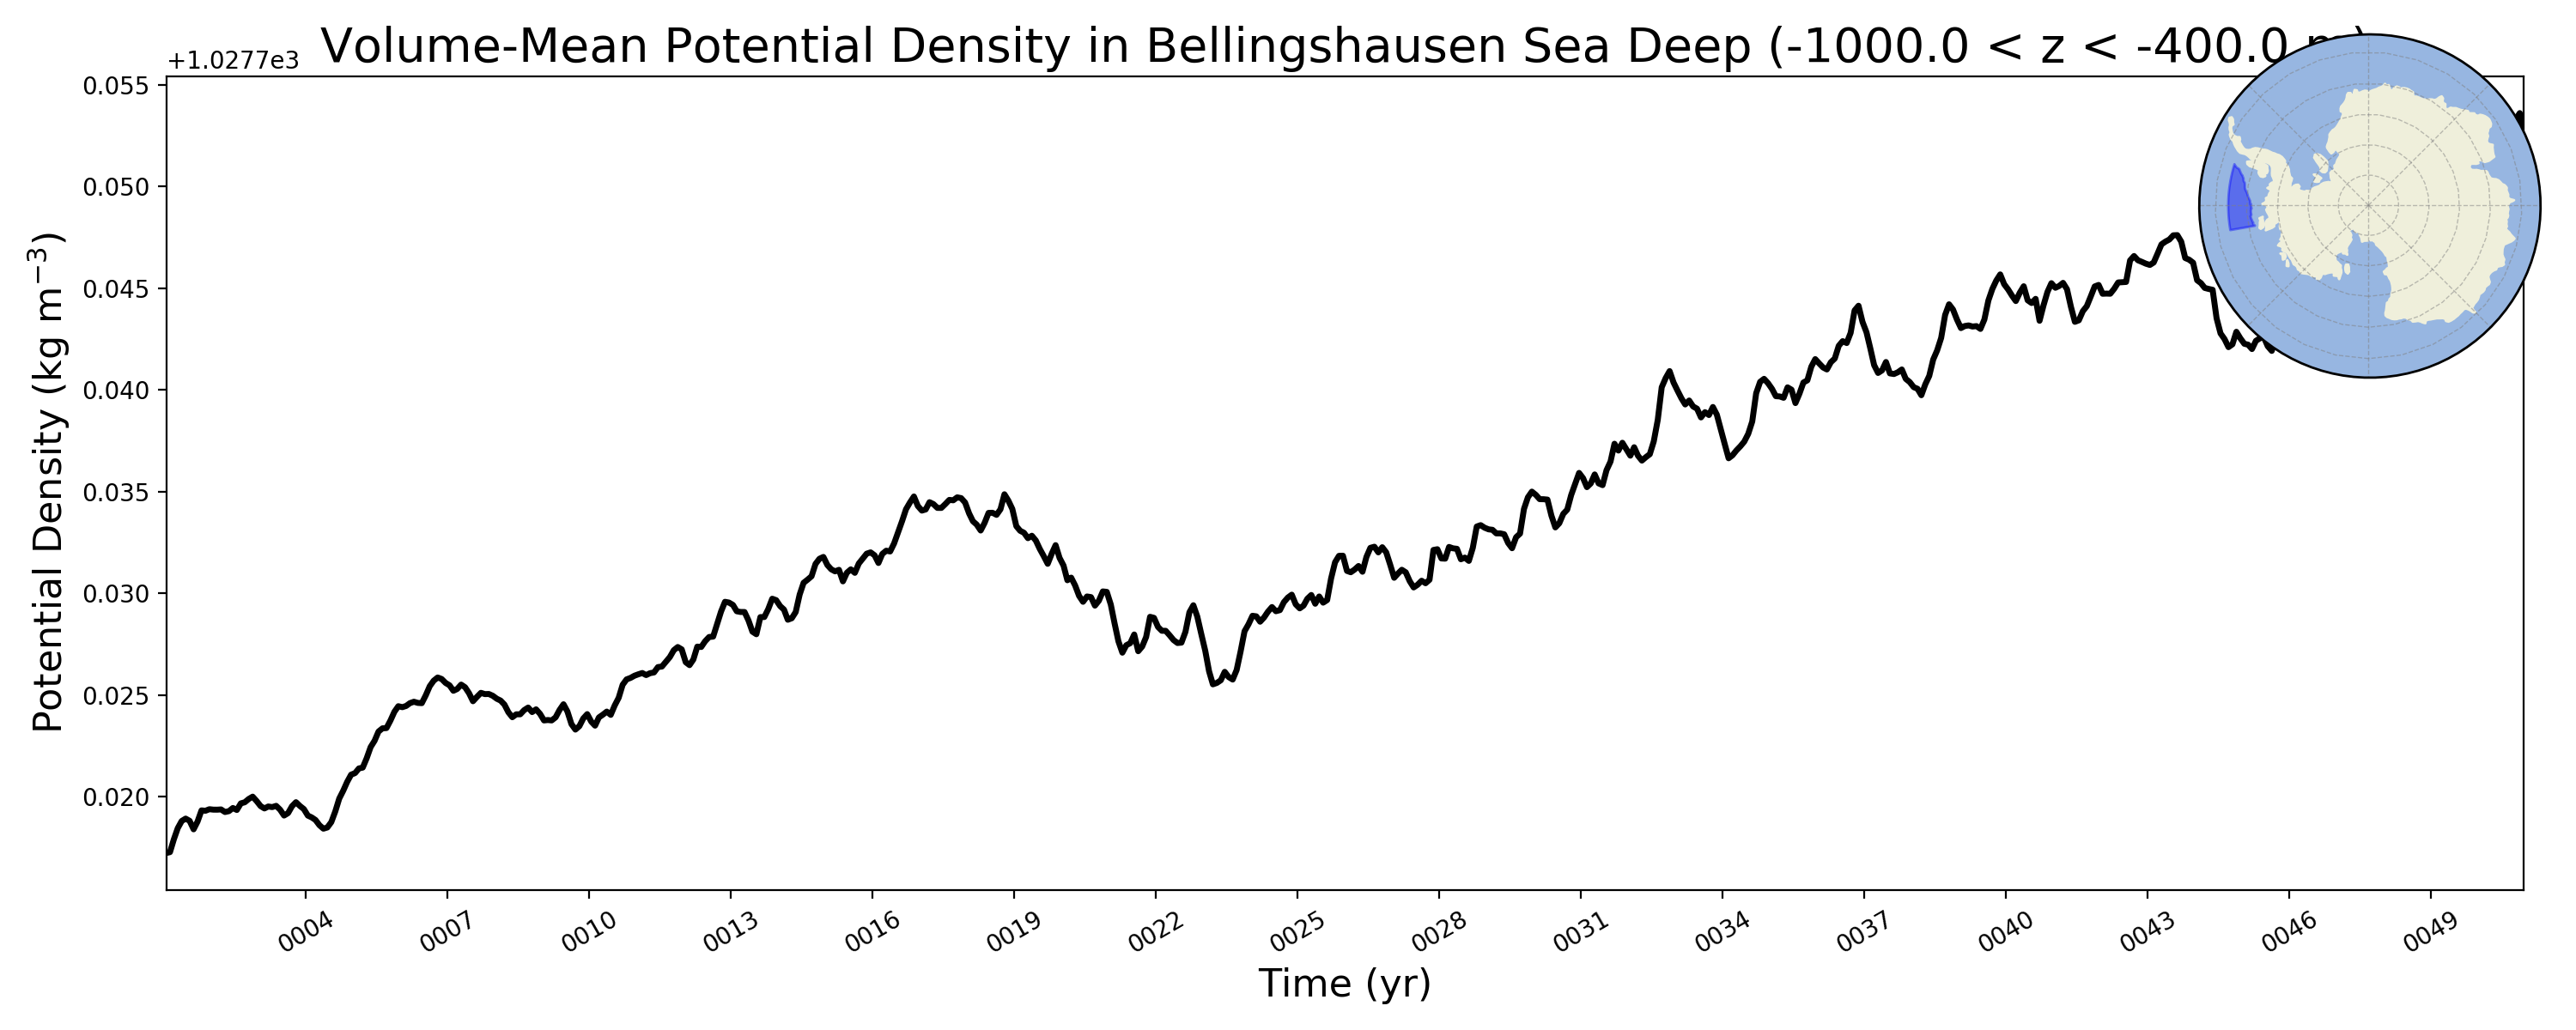
Bellingshausen Sea Deep
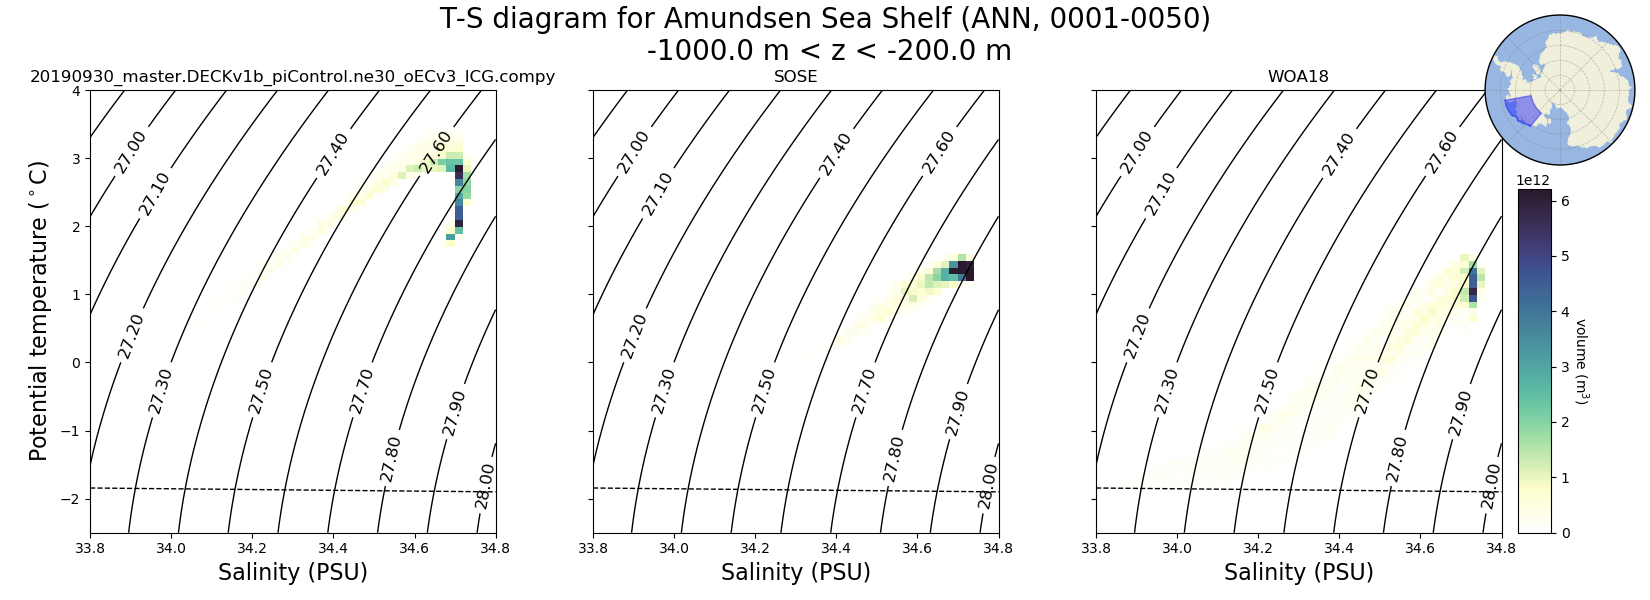
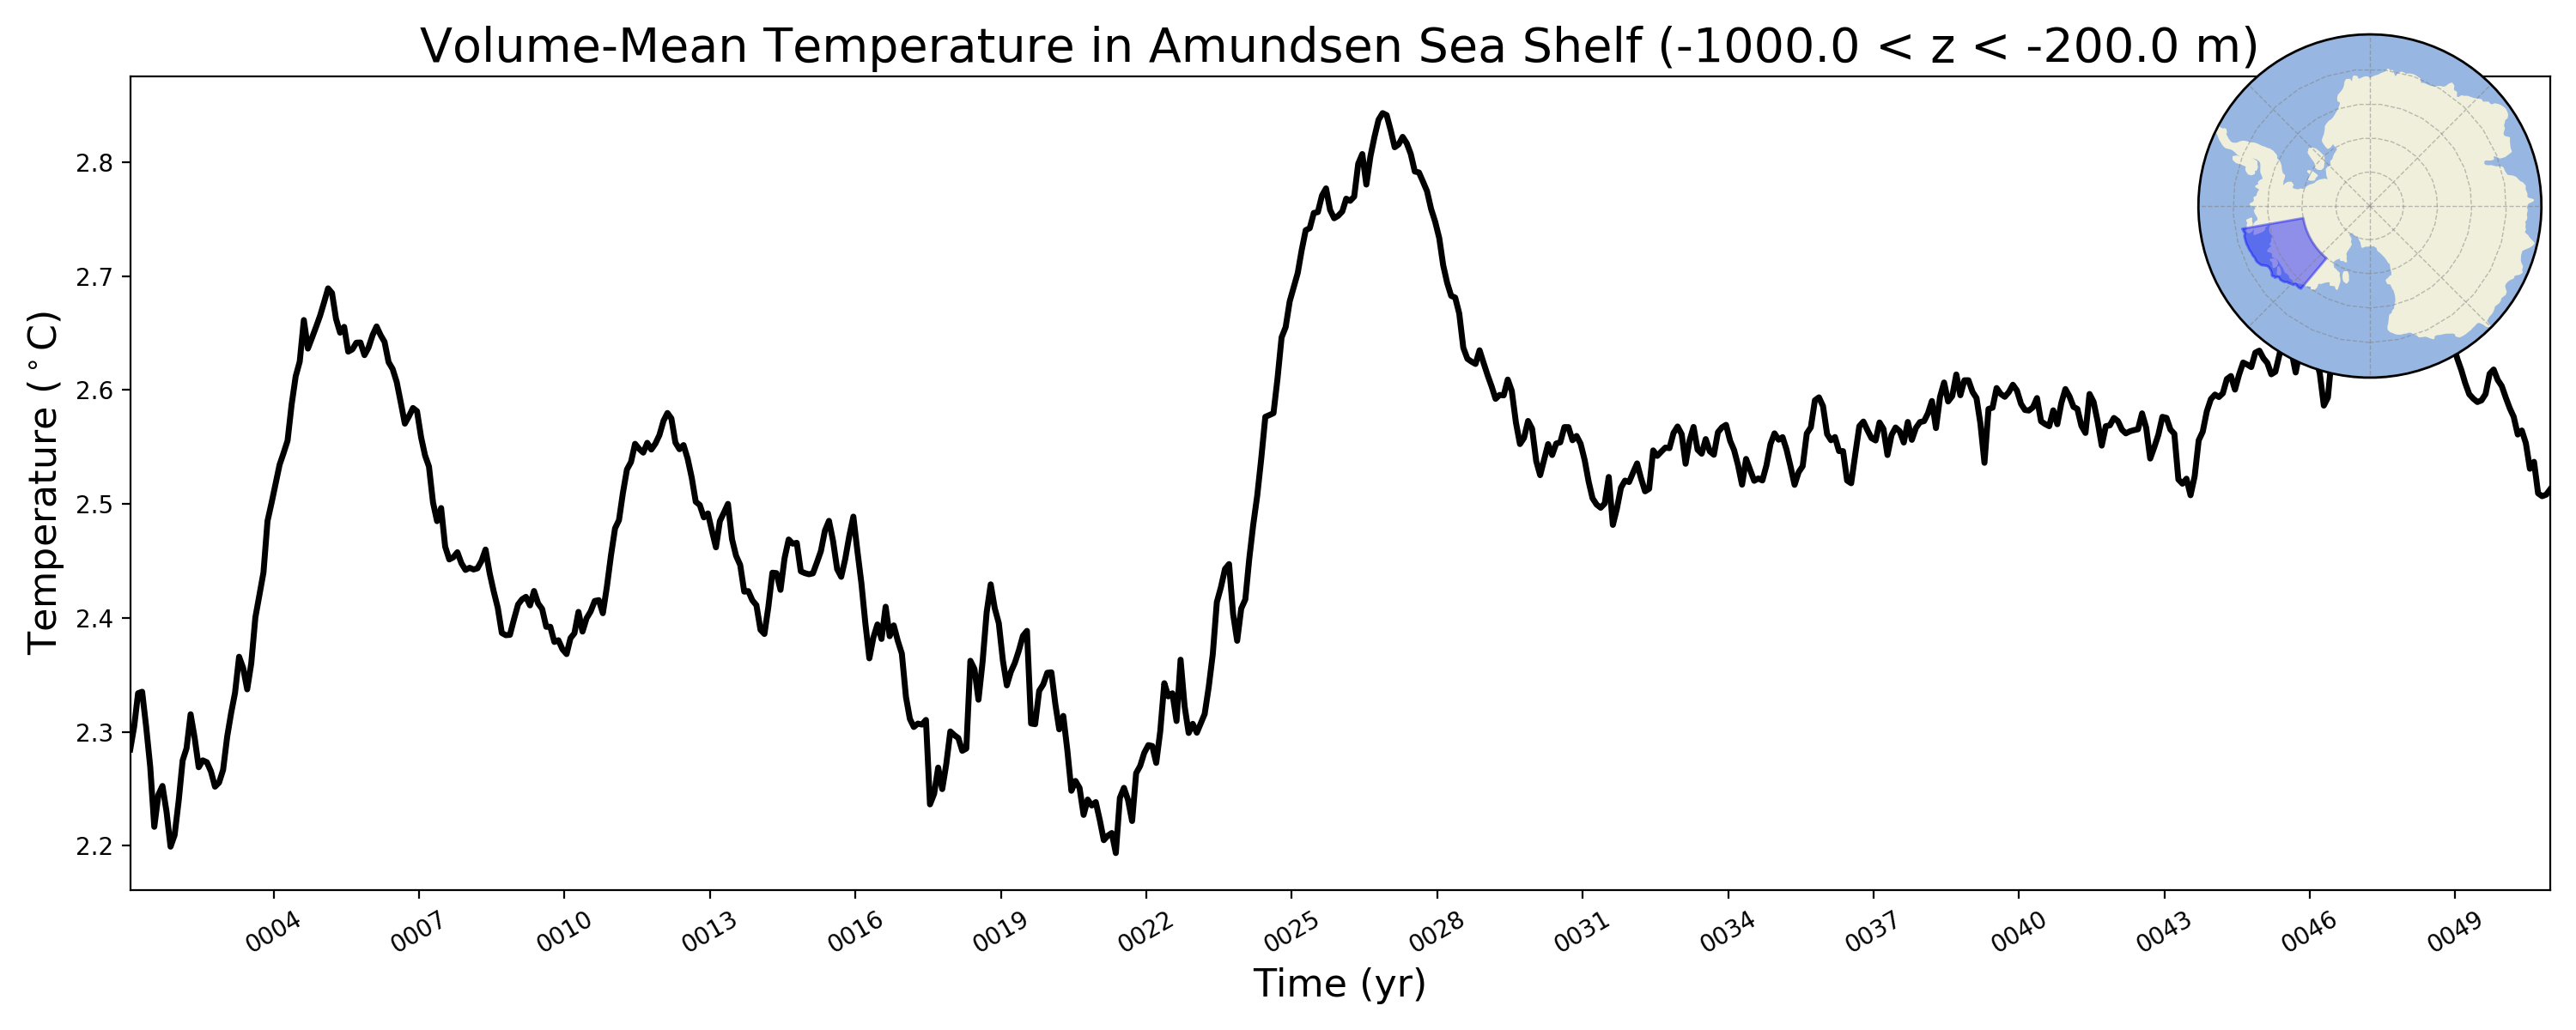
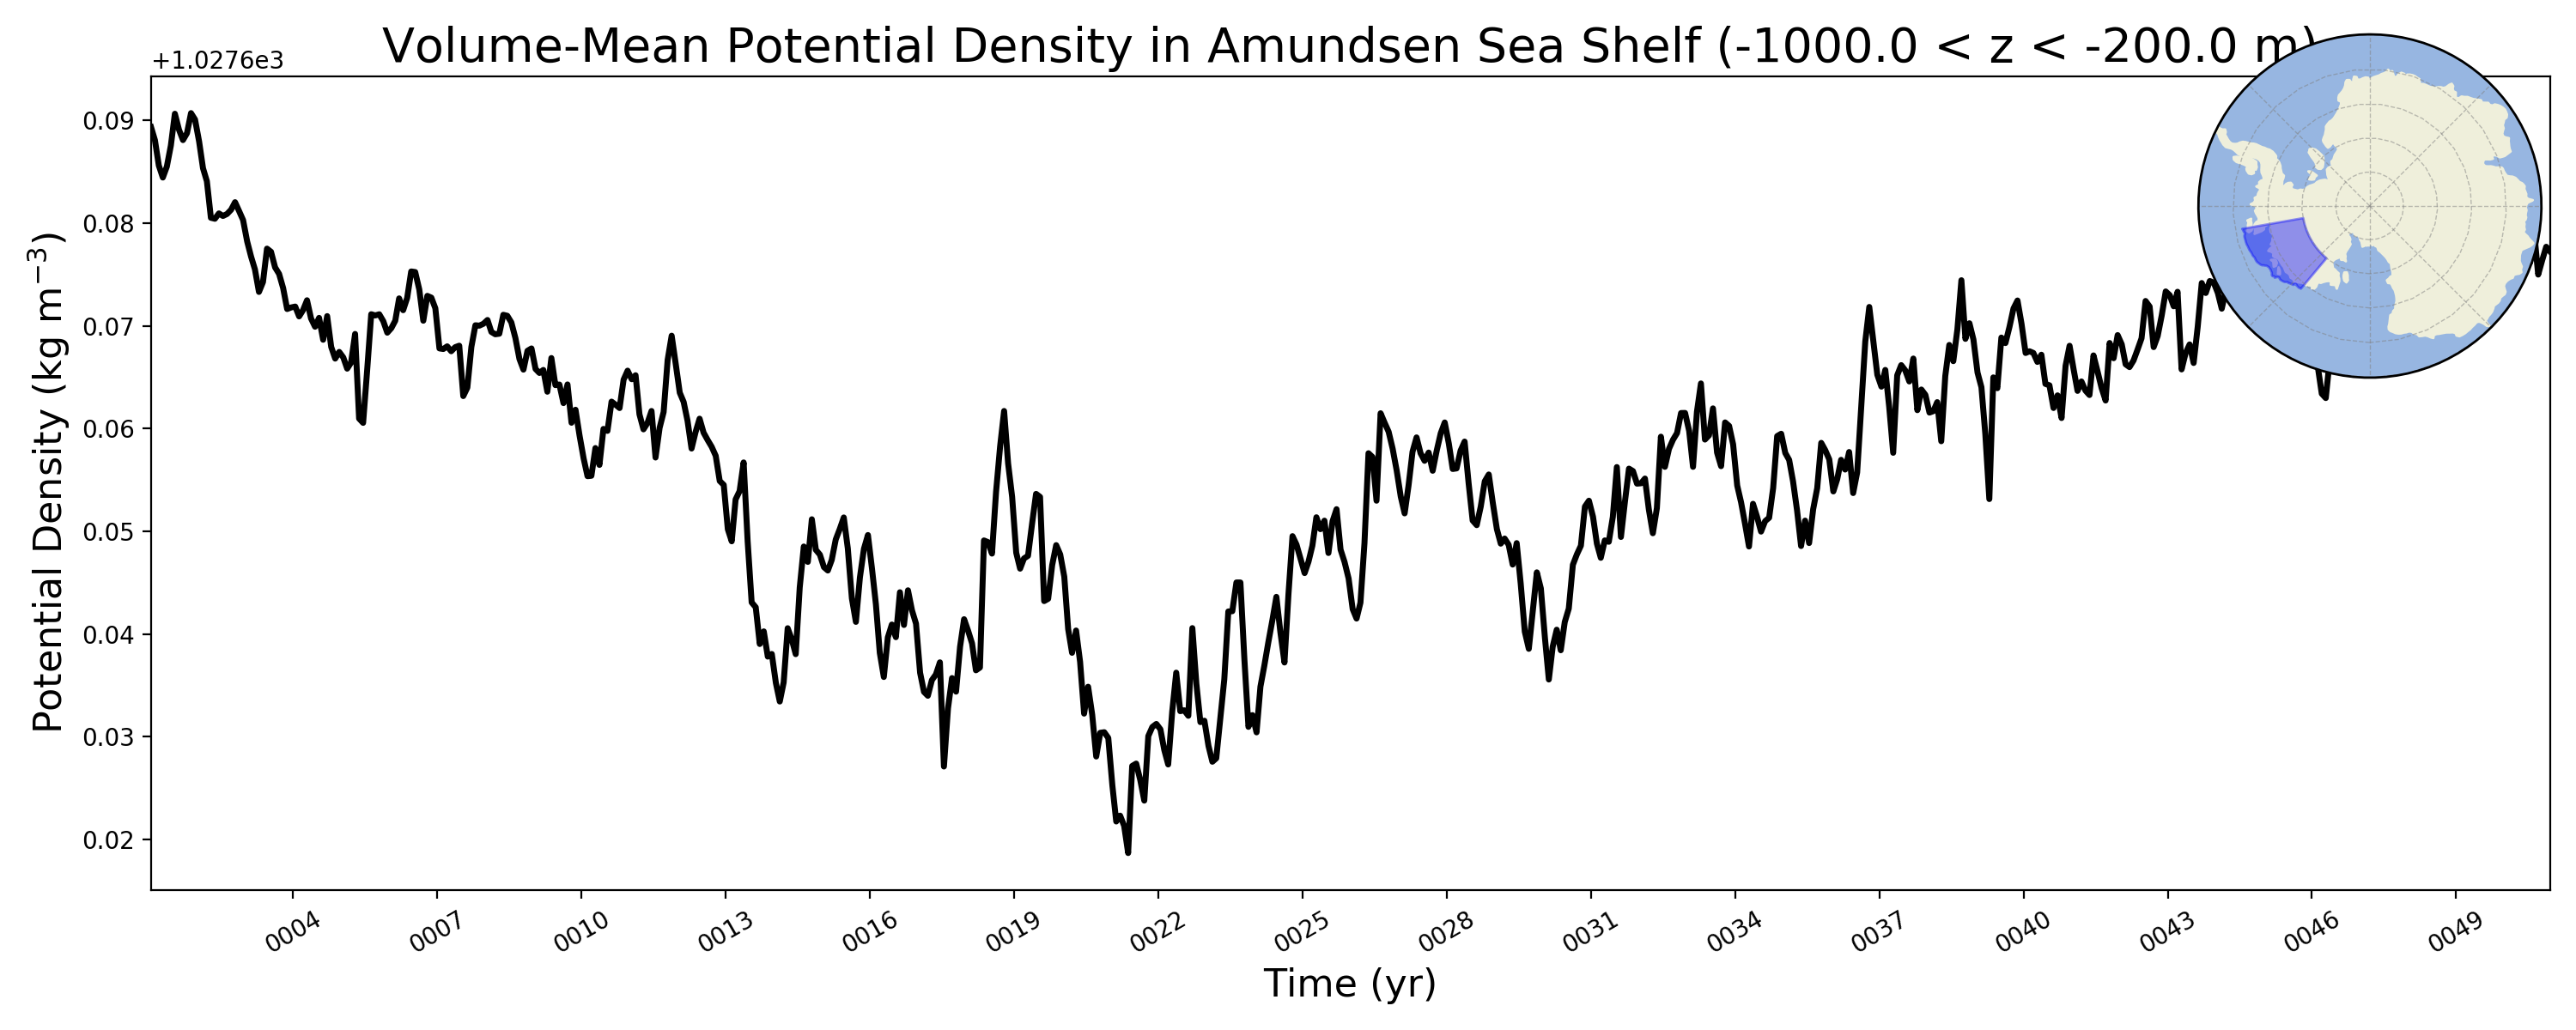
Amundsen Sea Shelf
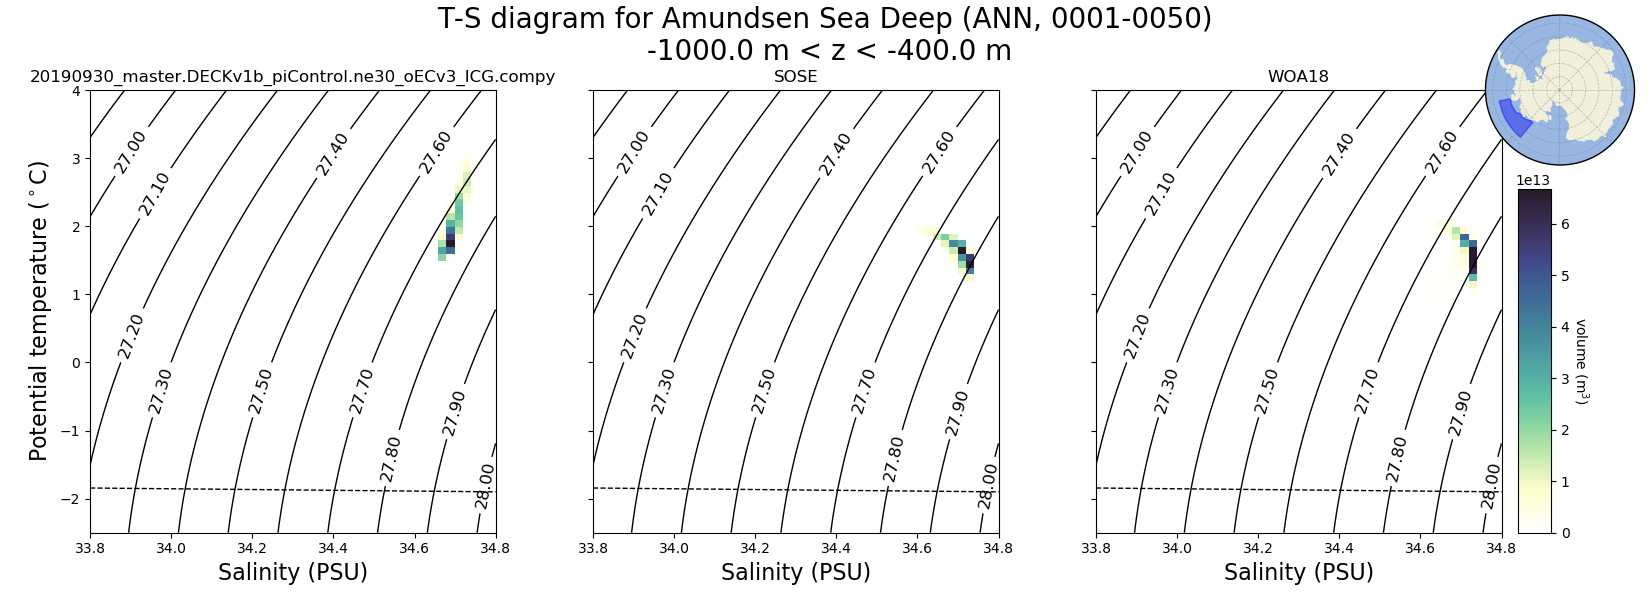
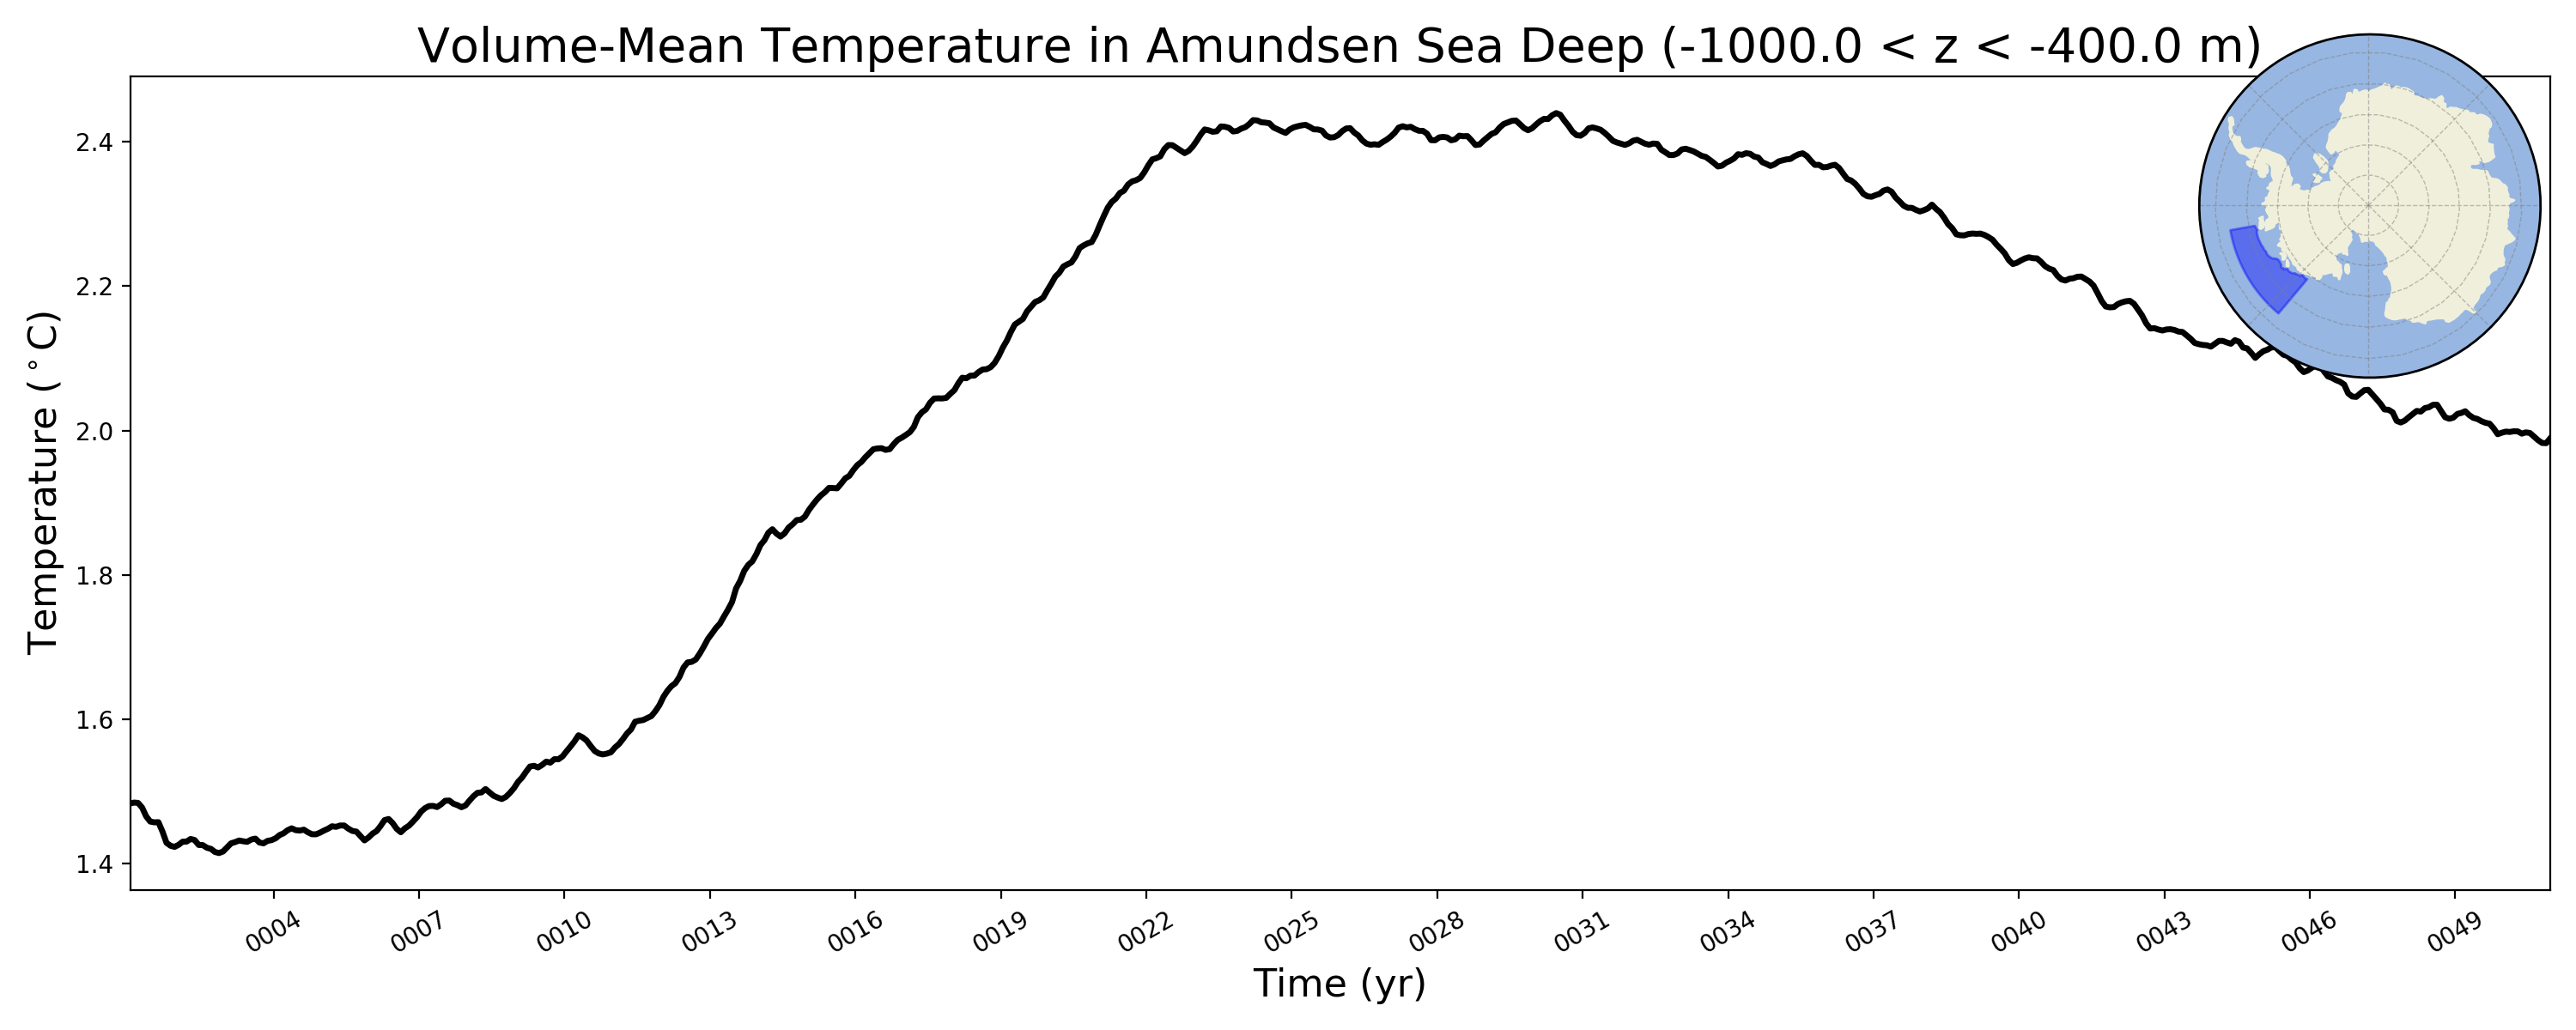
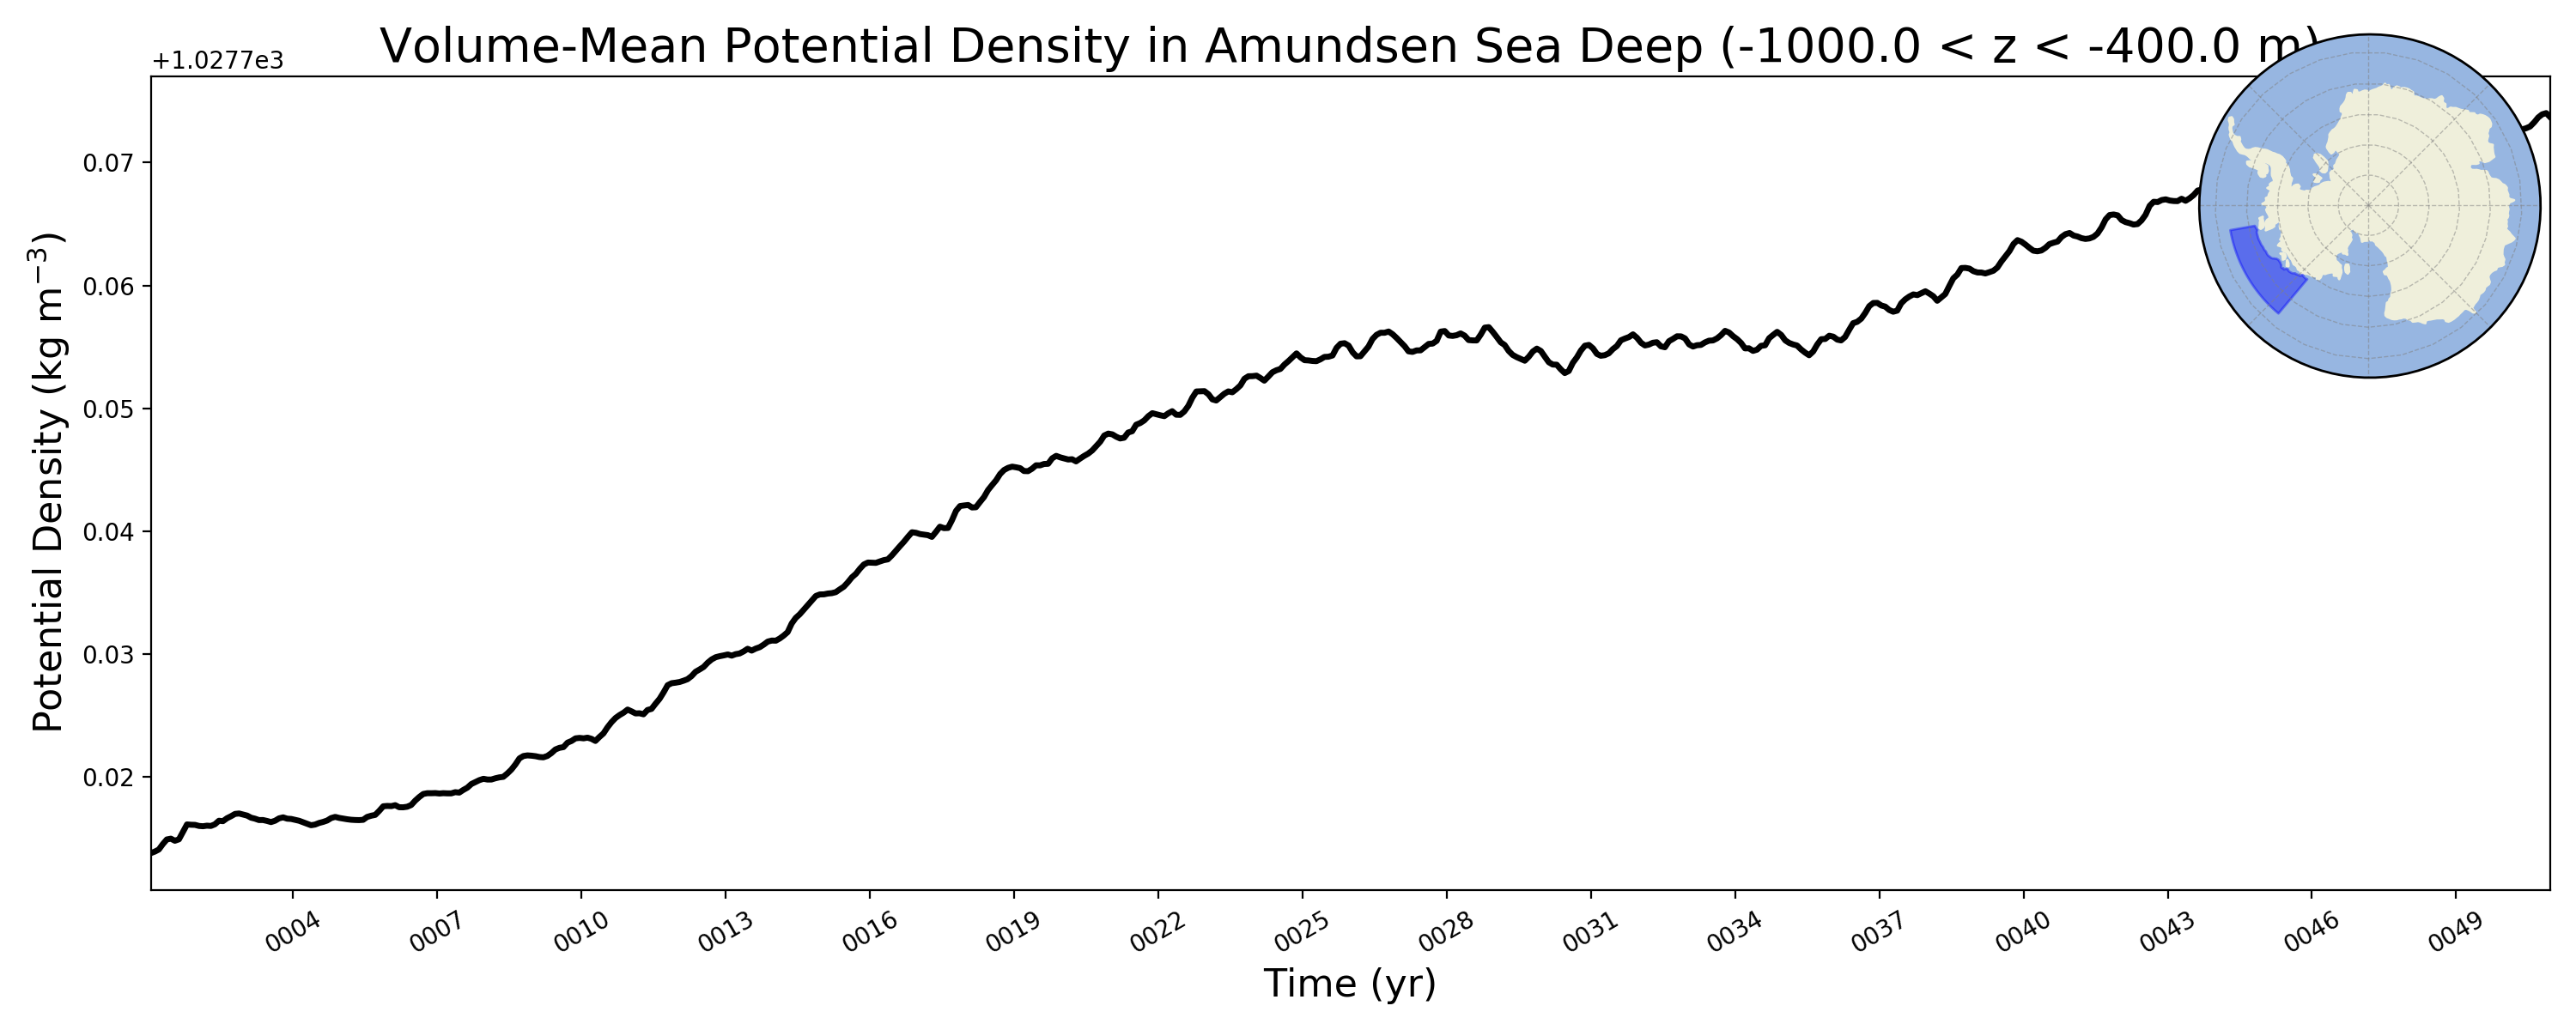
Amundsen Sea Deep
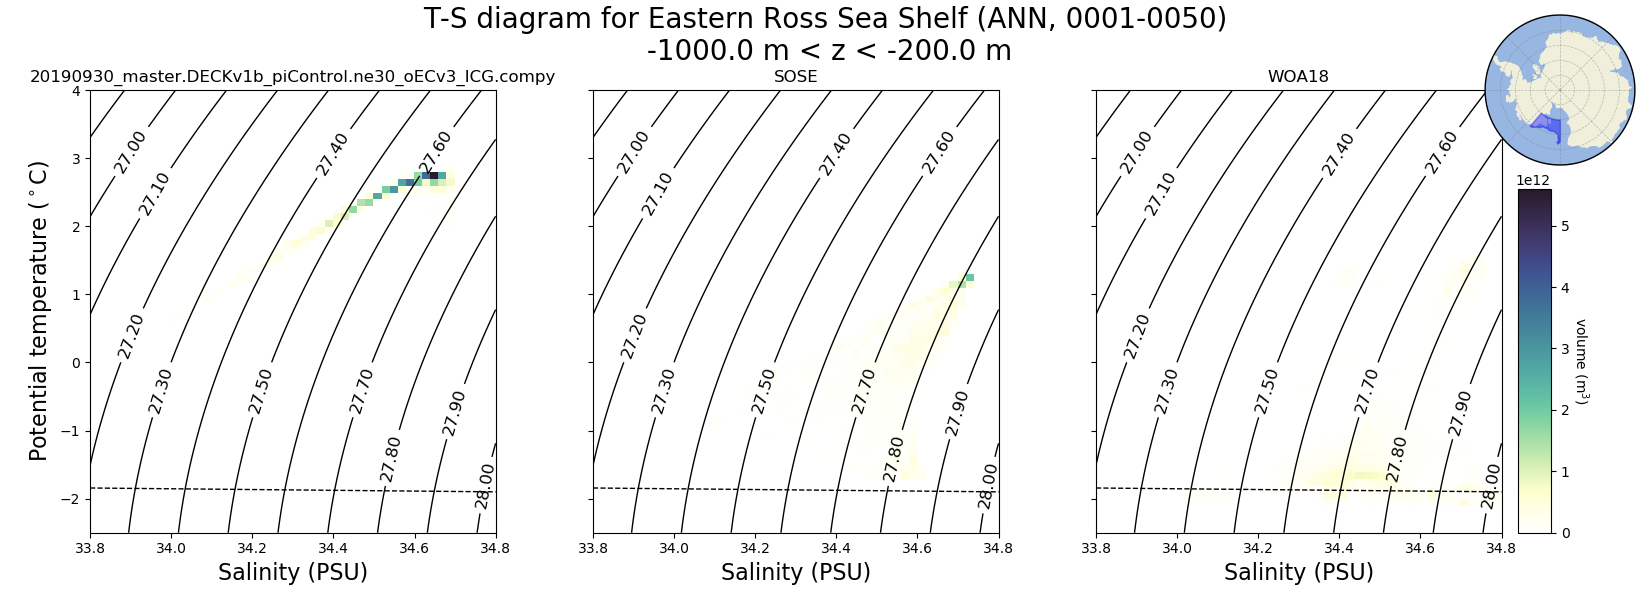
Eastern Ross Sea Shelf
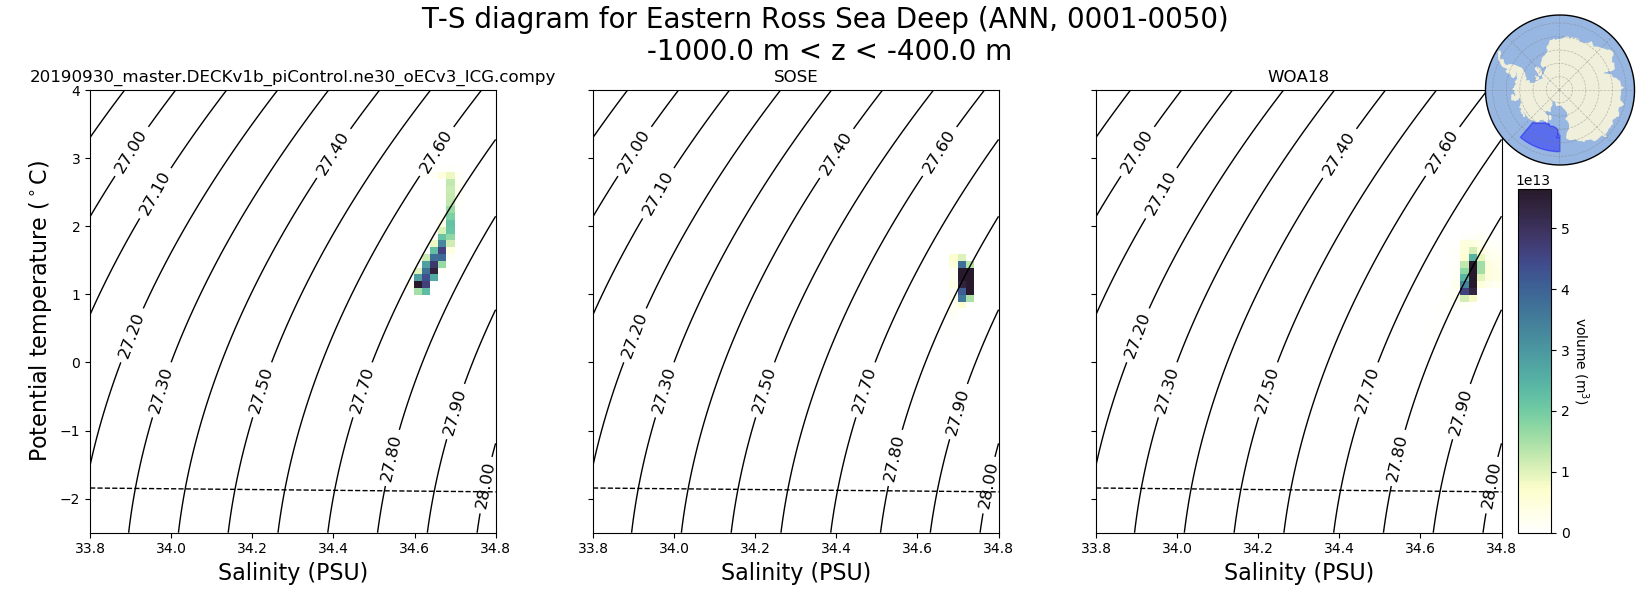
Eastern Ross Sea Deep
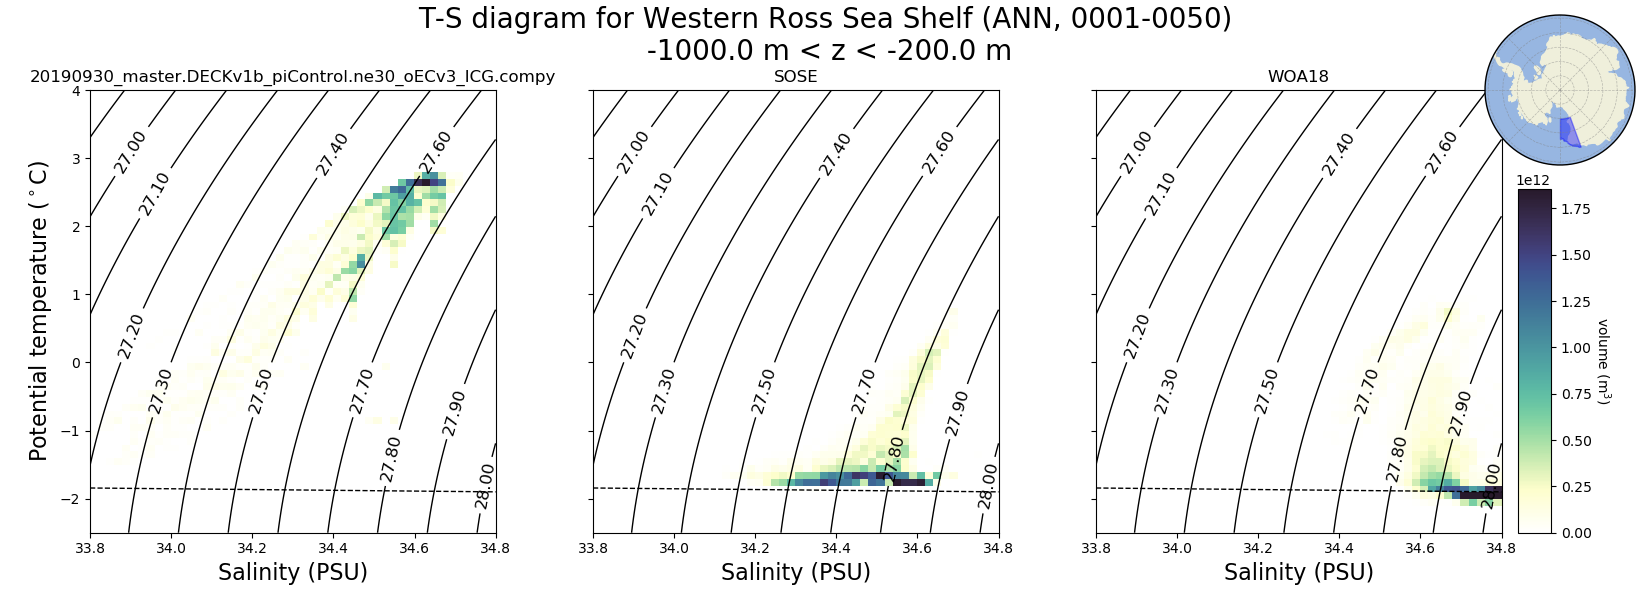
Western Ross Sea Shelf
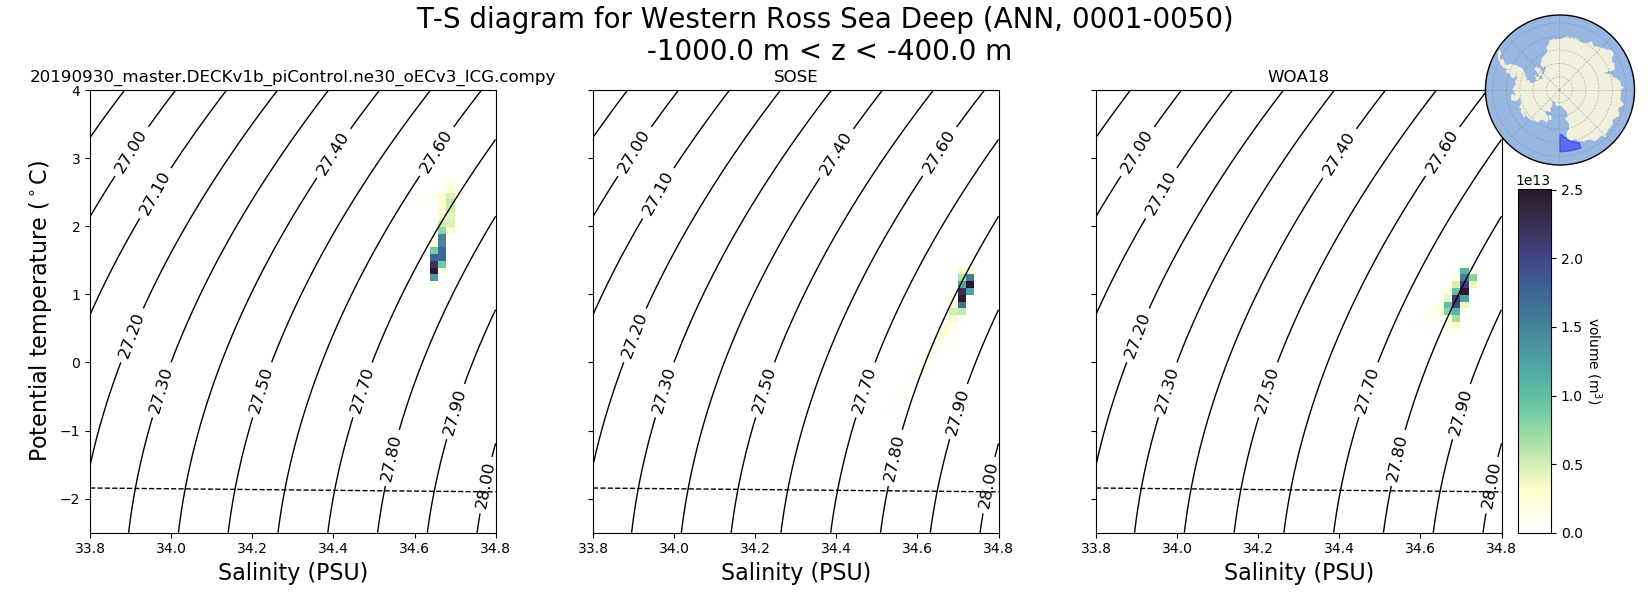
Western Ross Sea Deep
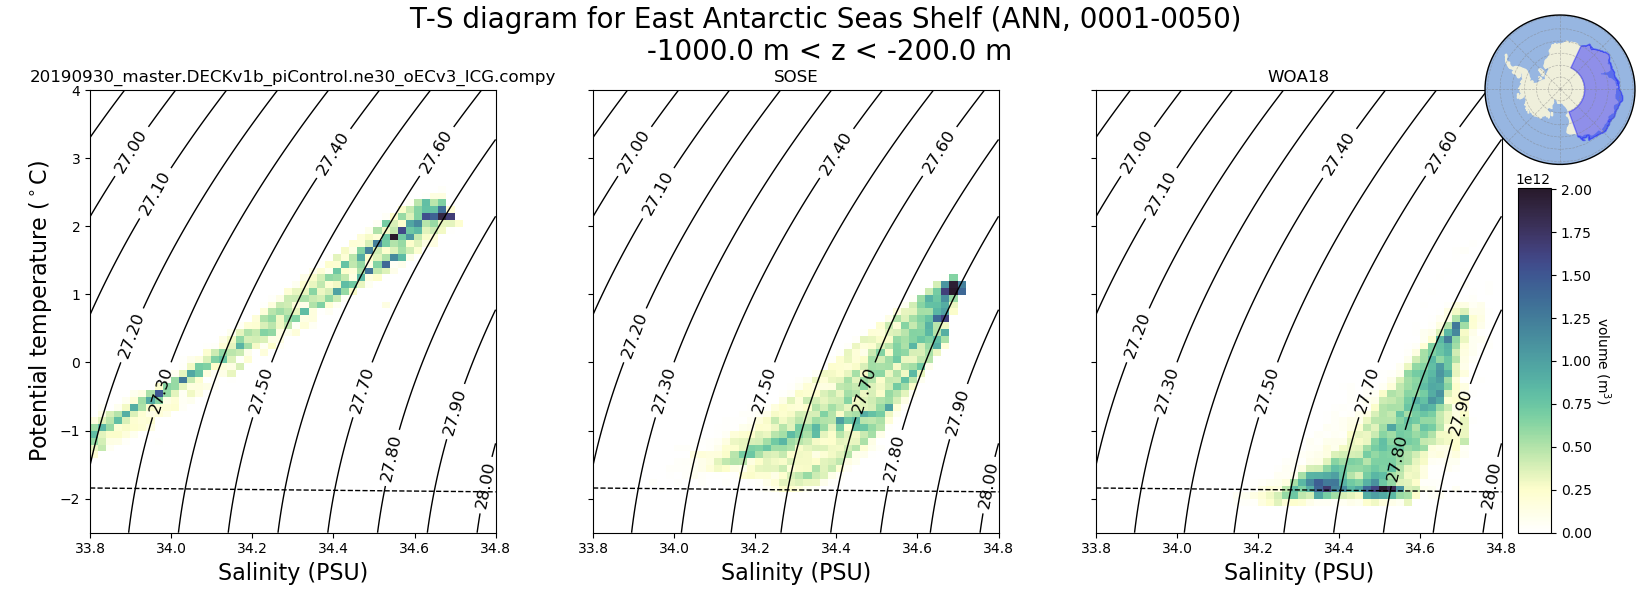
East Antarctic Seas Shelf
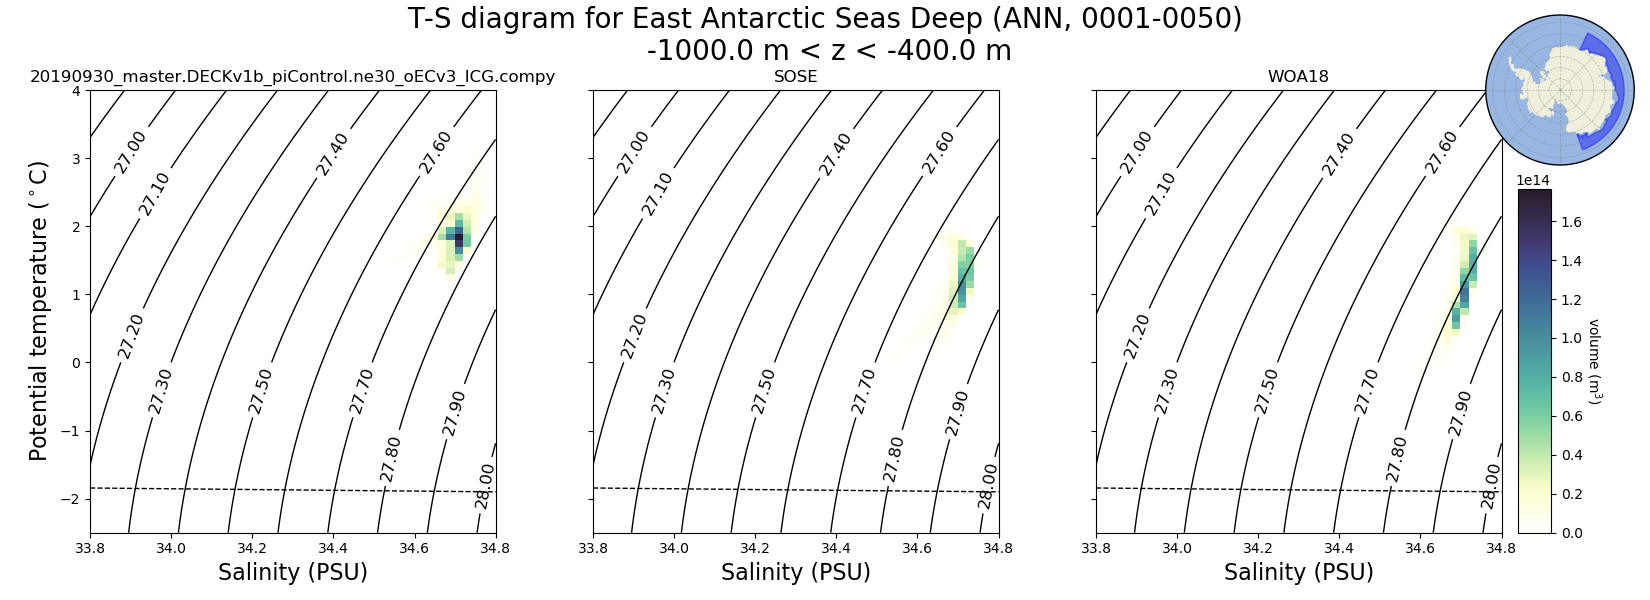
East Antarctic Seas Deep
Ocean Basins

Atlantic_Basin

Pacific_Basin

Indian_Basin

Arctic_Basin

Southern_Ocean_Basin

Mediterranean_Basin
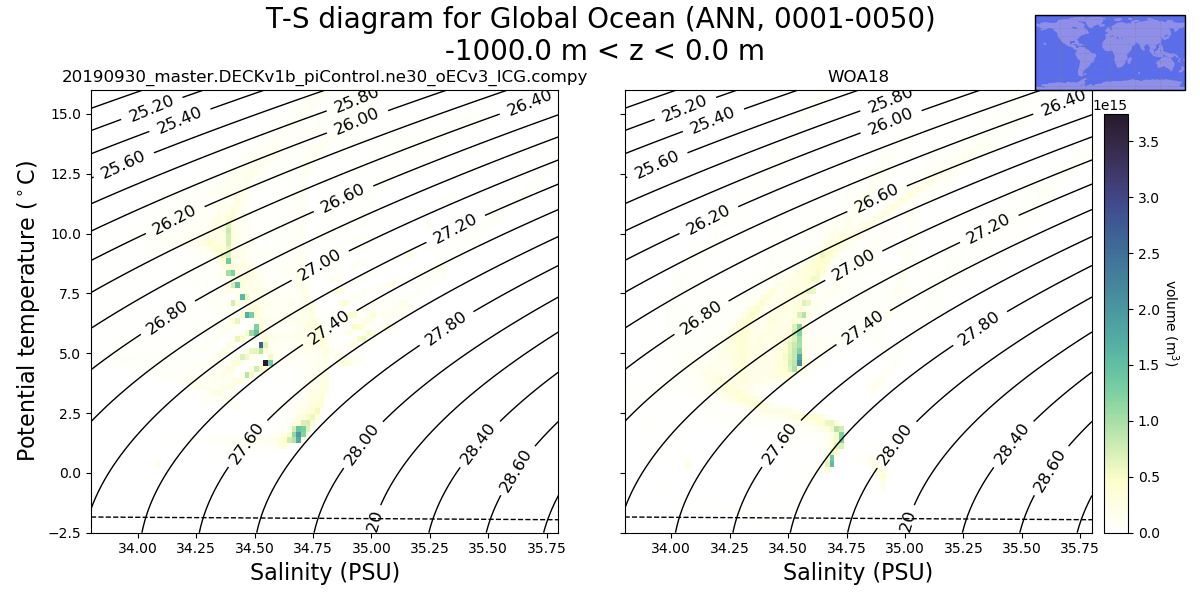
Global Ocean
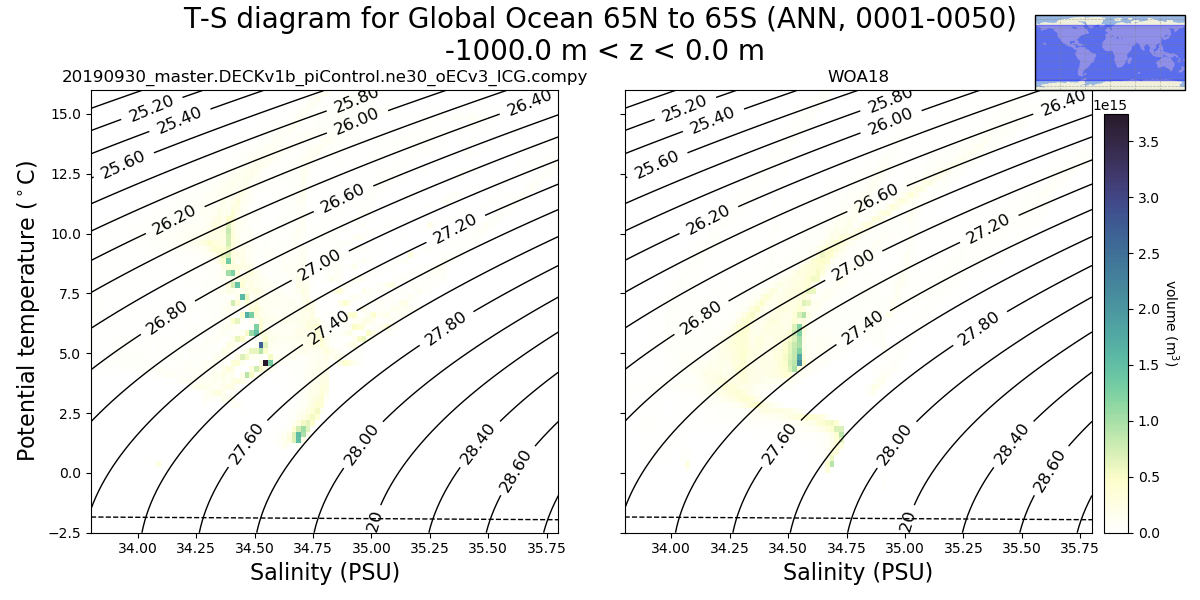
Global Ocean 65N to 65S
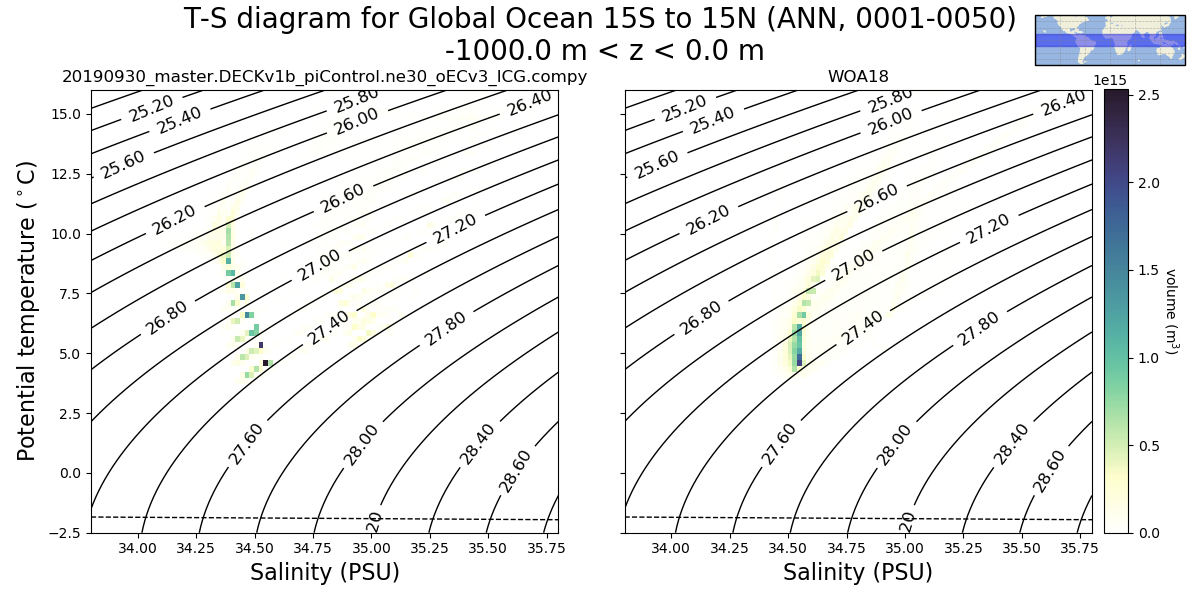
Global Ocean 15S to 15N
Temperature
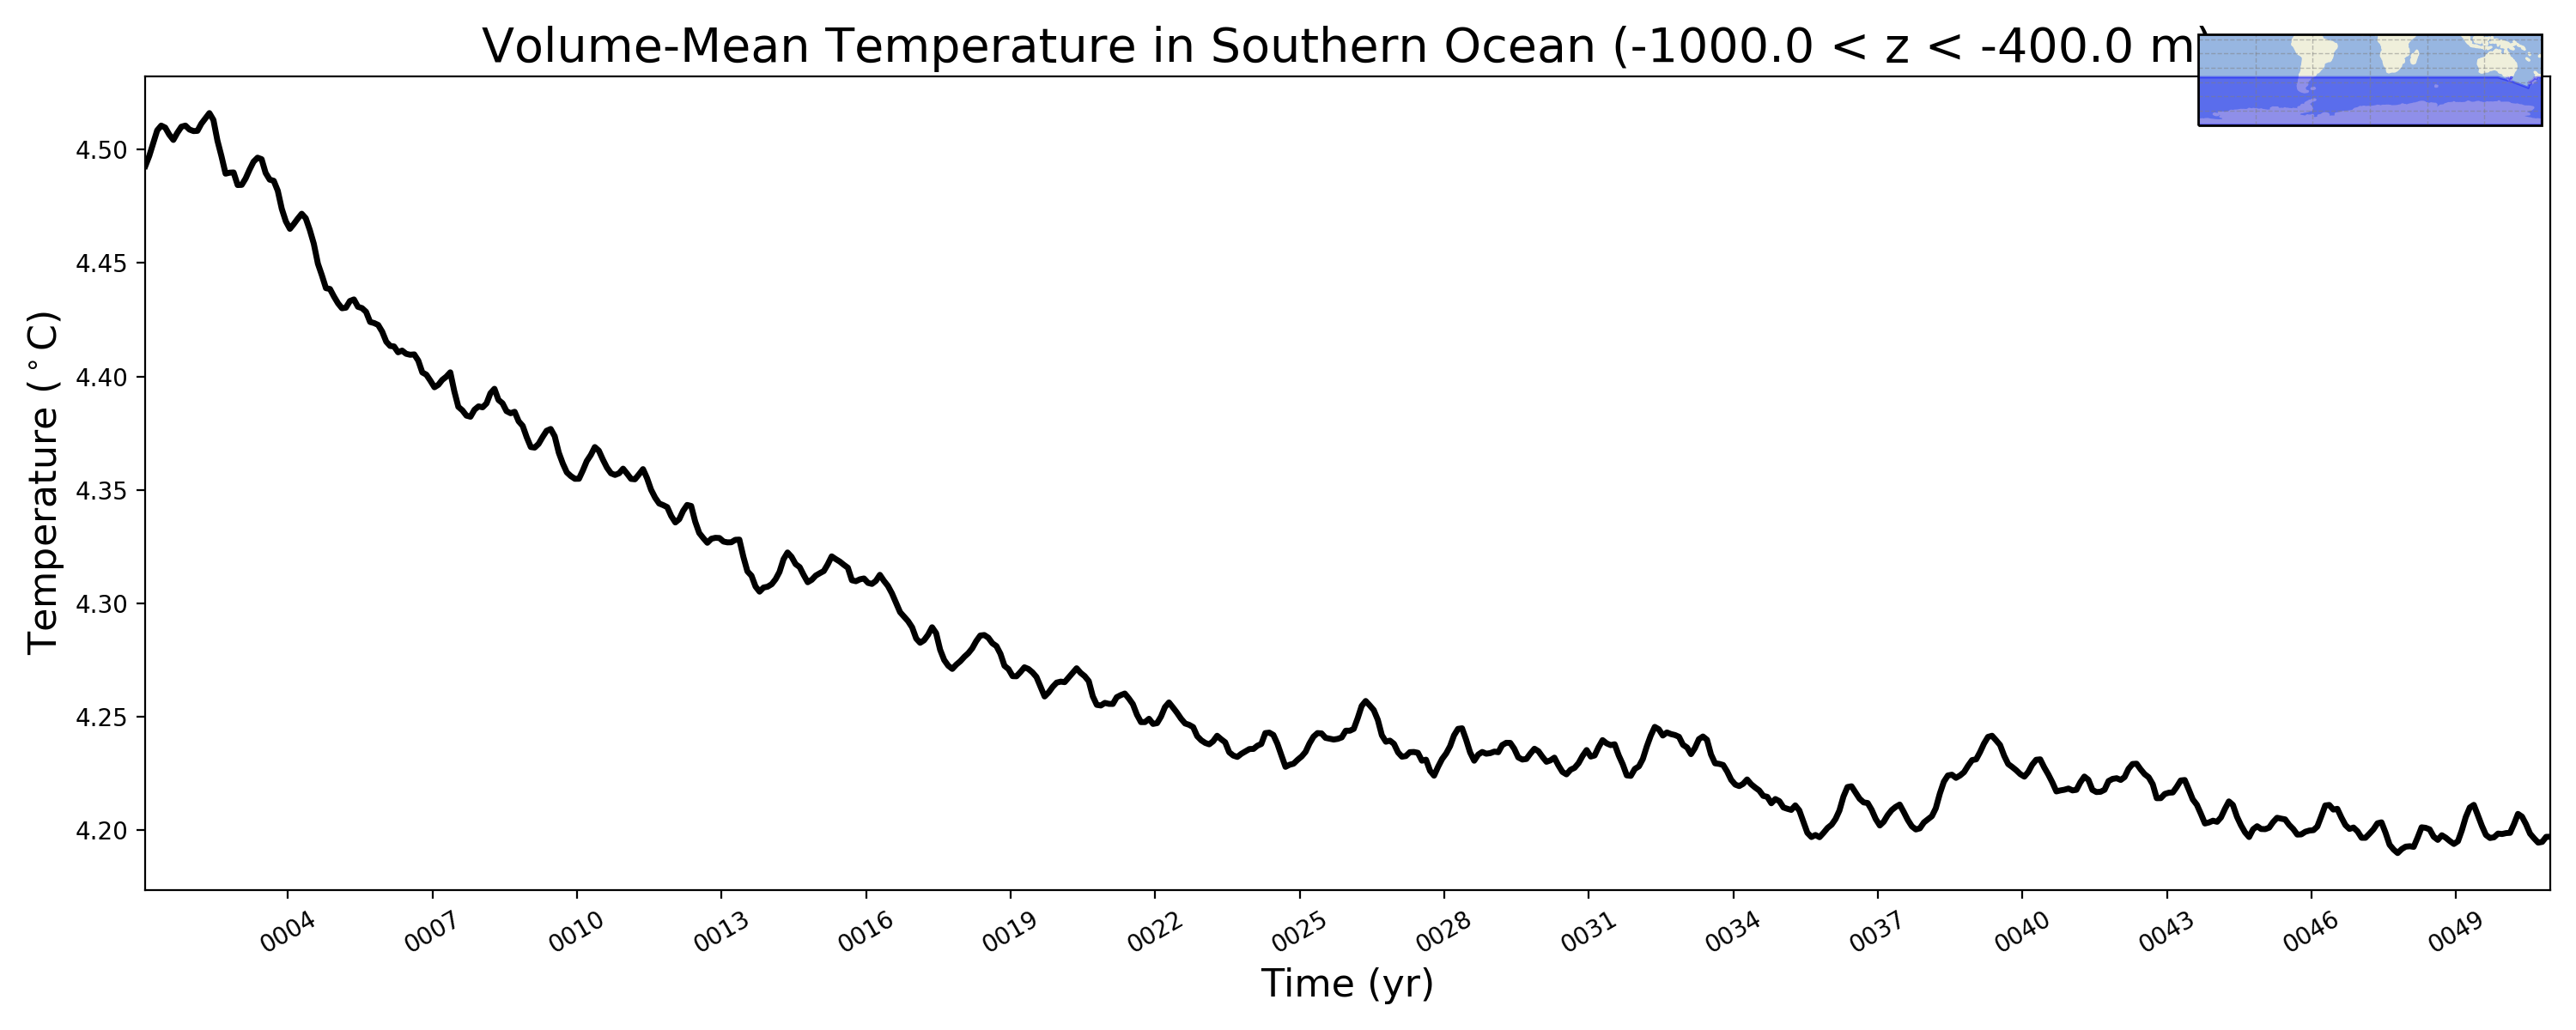
Southern Ocean
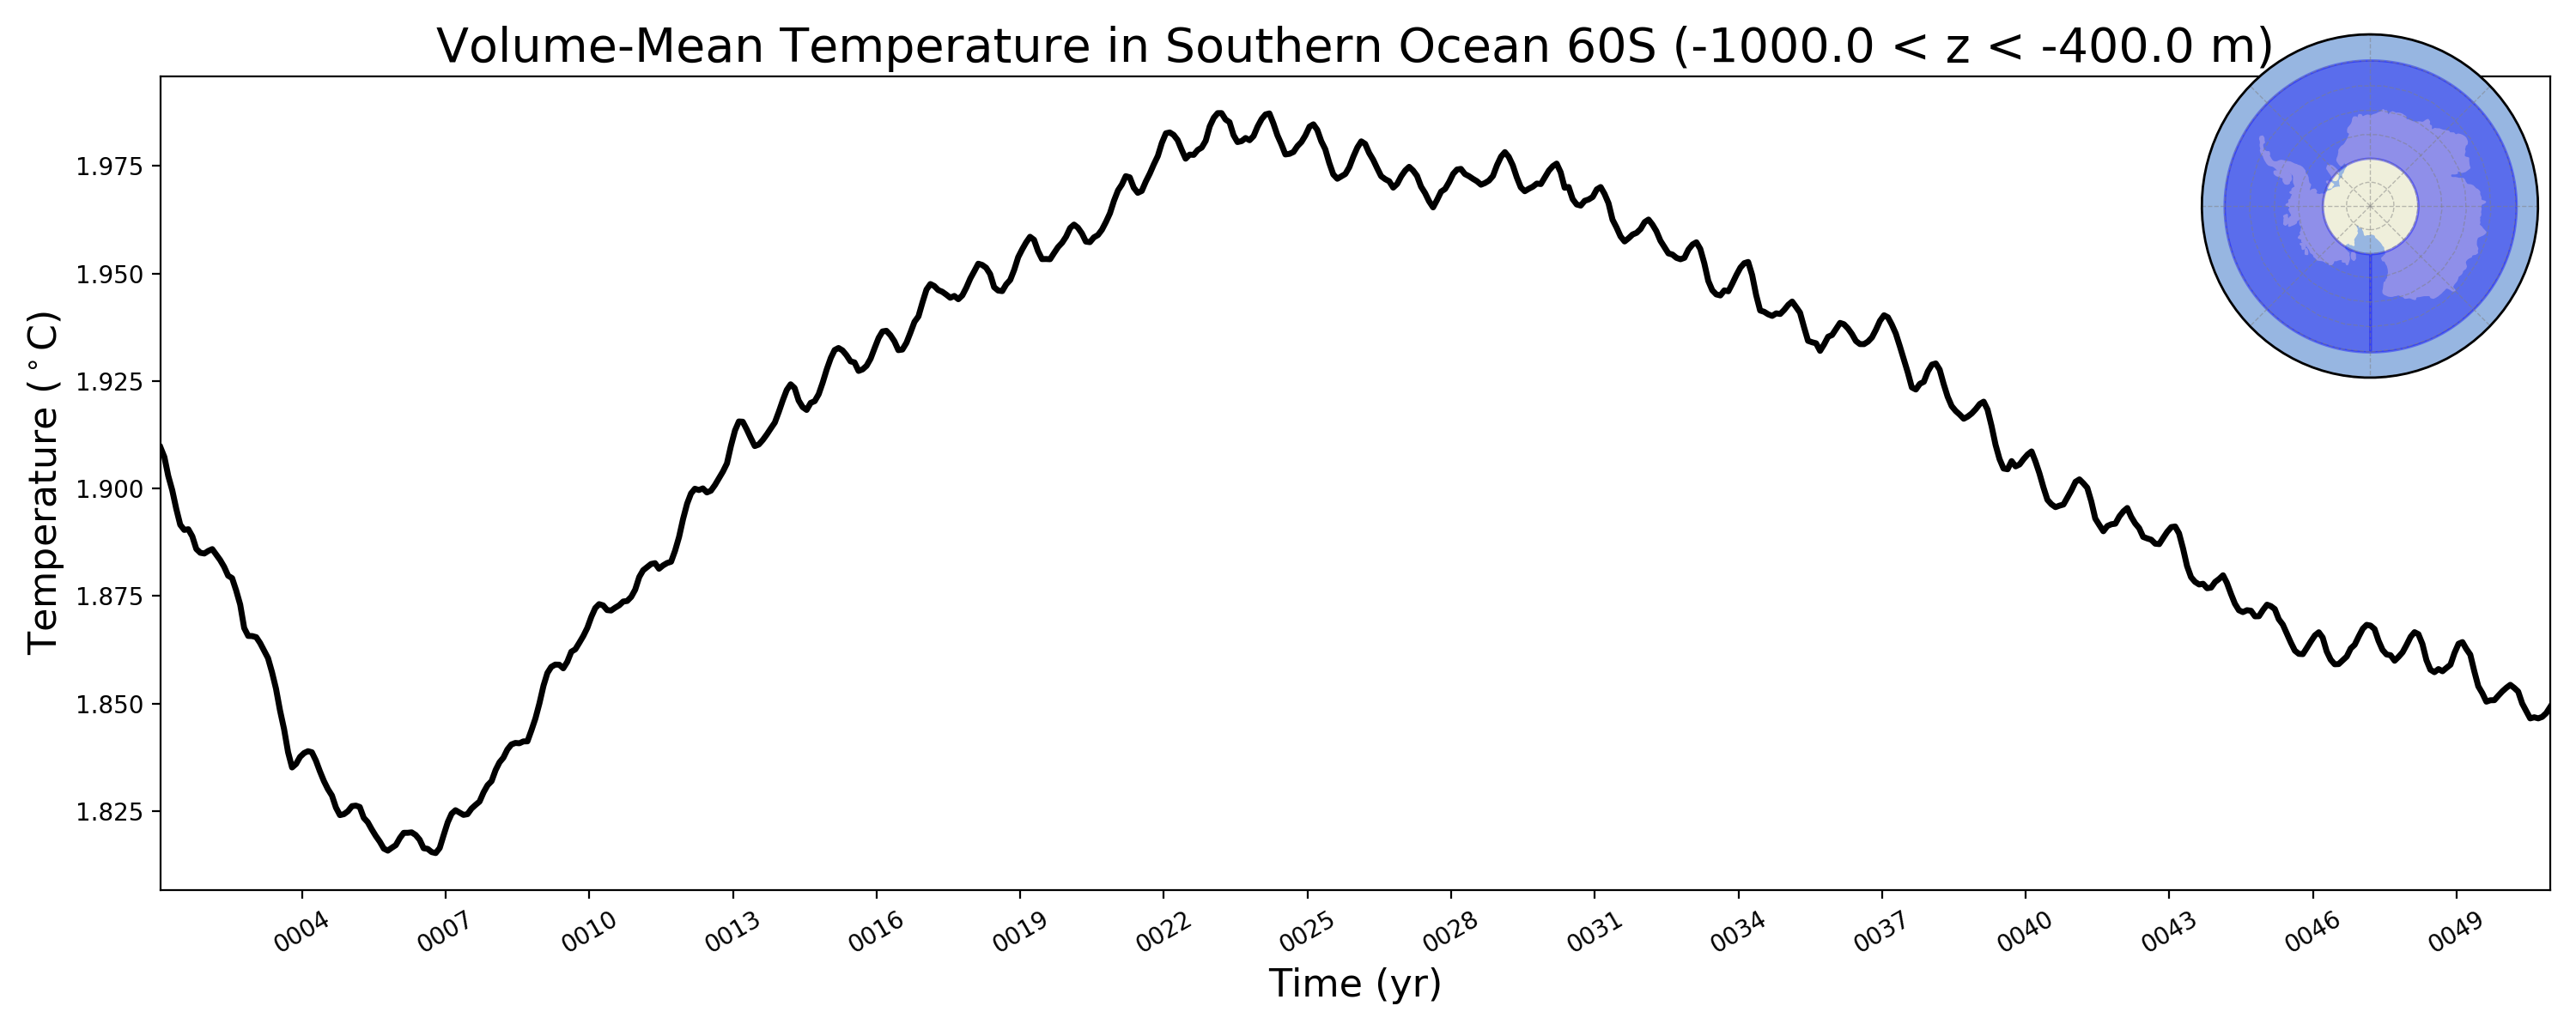
Southern Ocean 60S
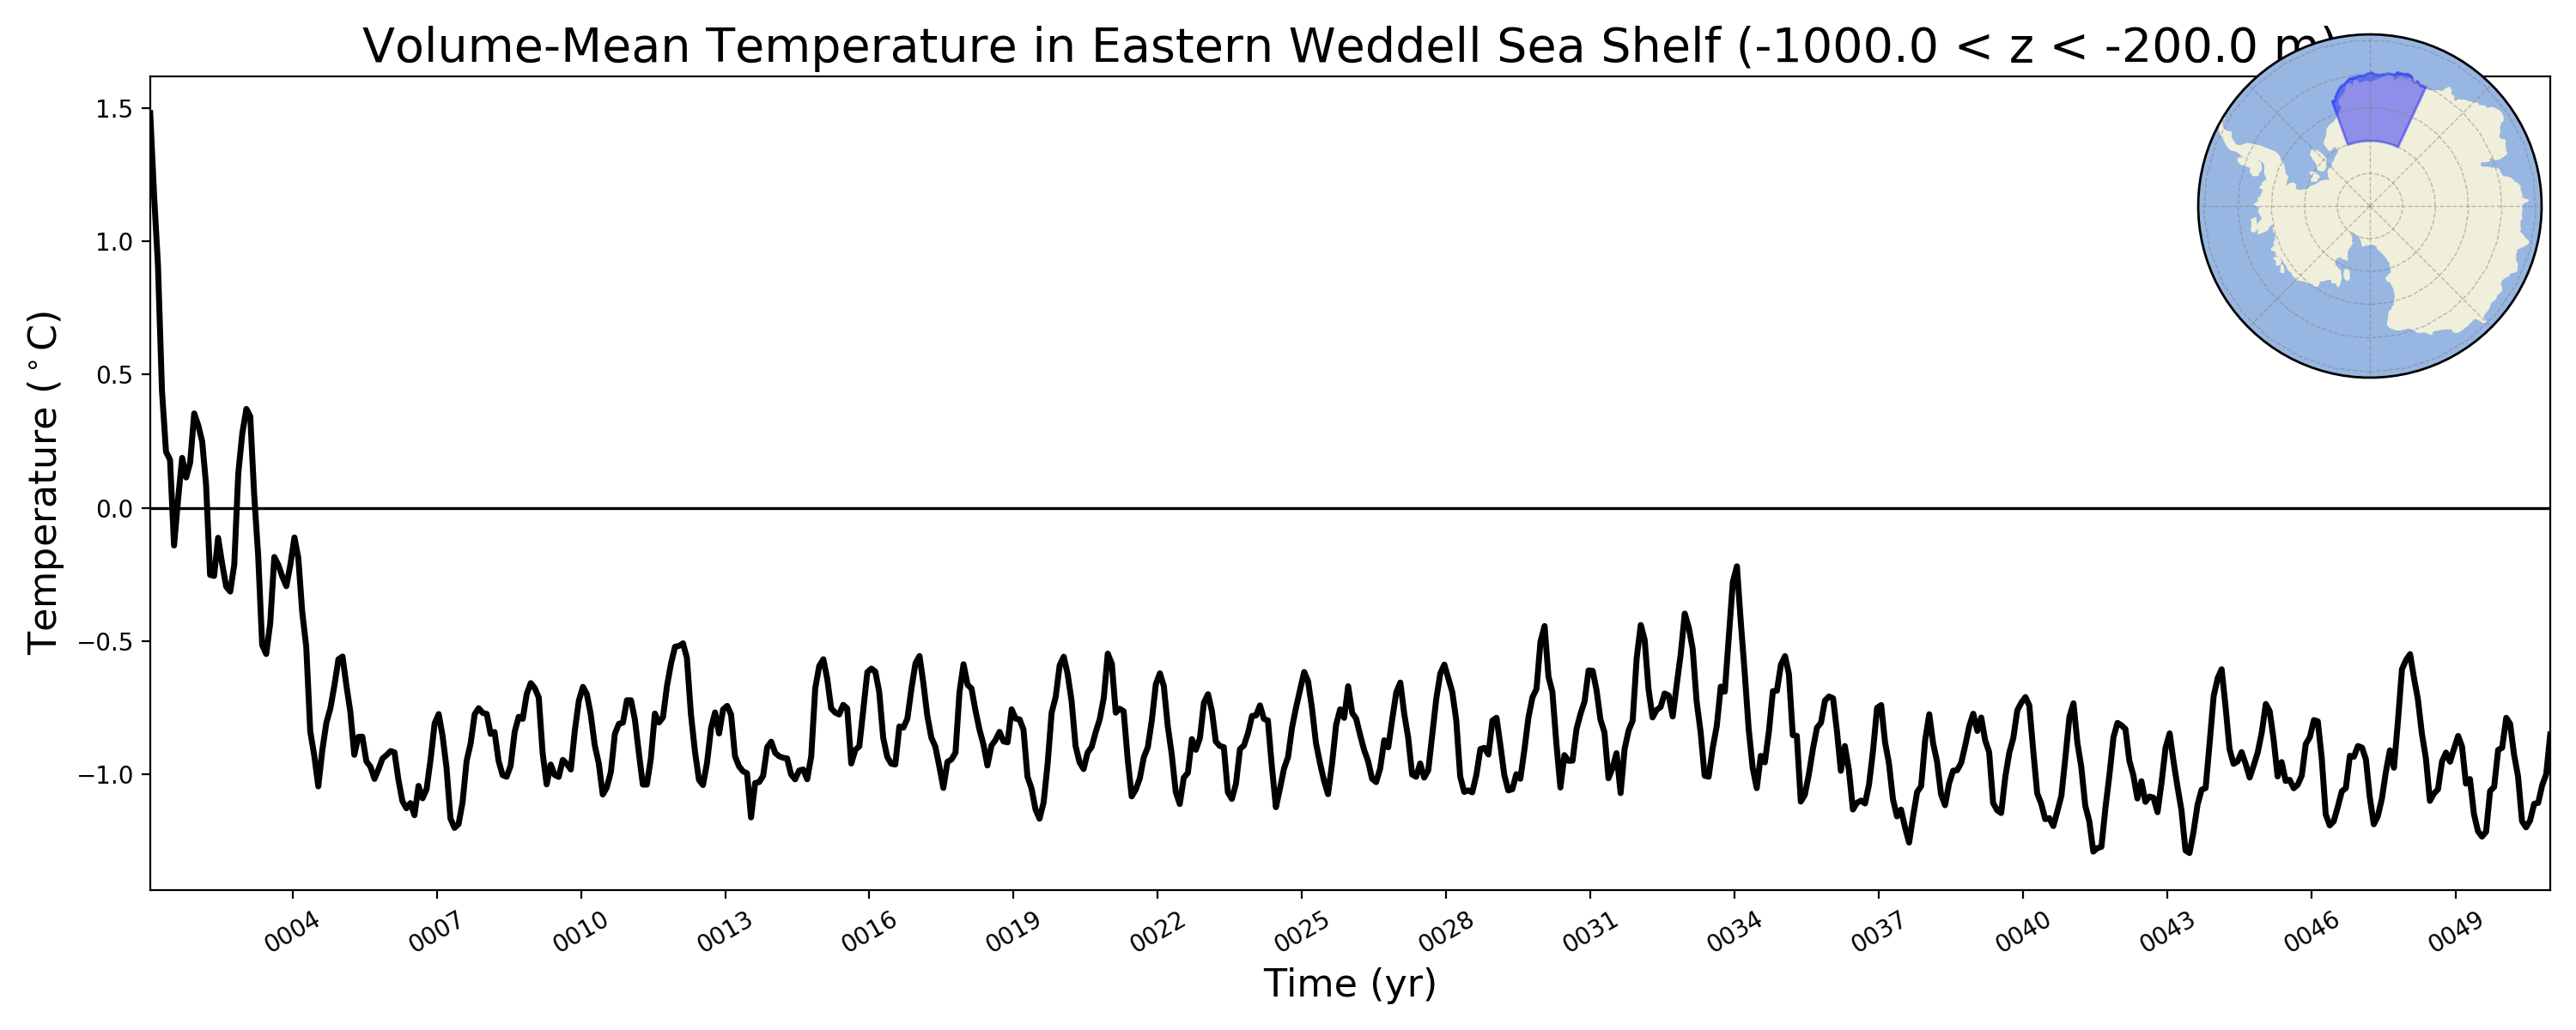
Eastern Weddell Sea Shelf
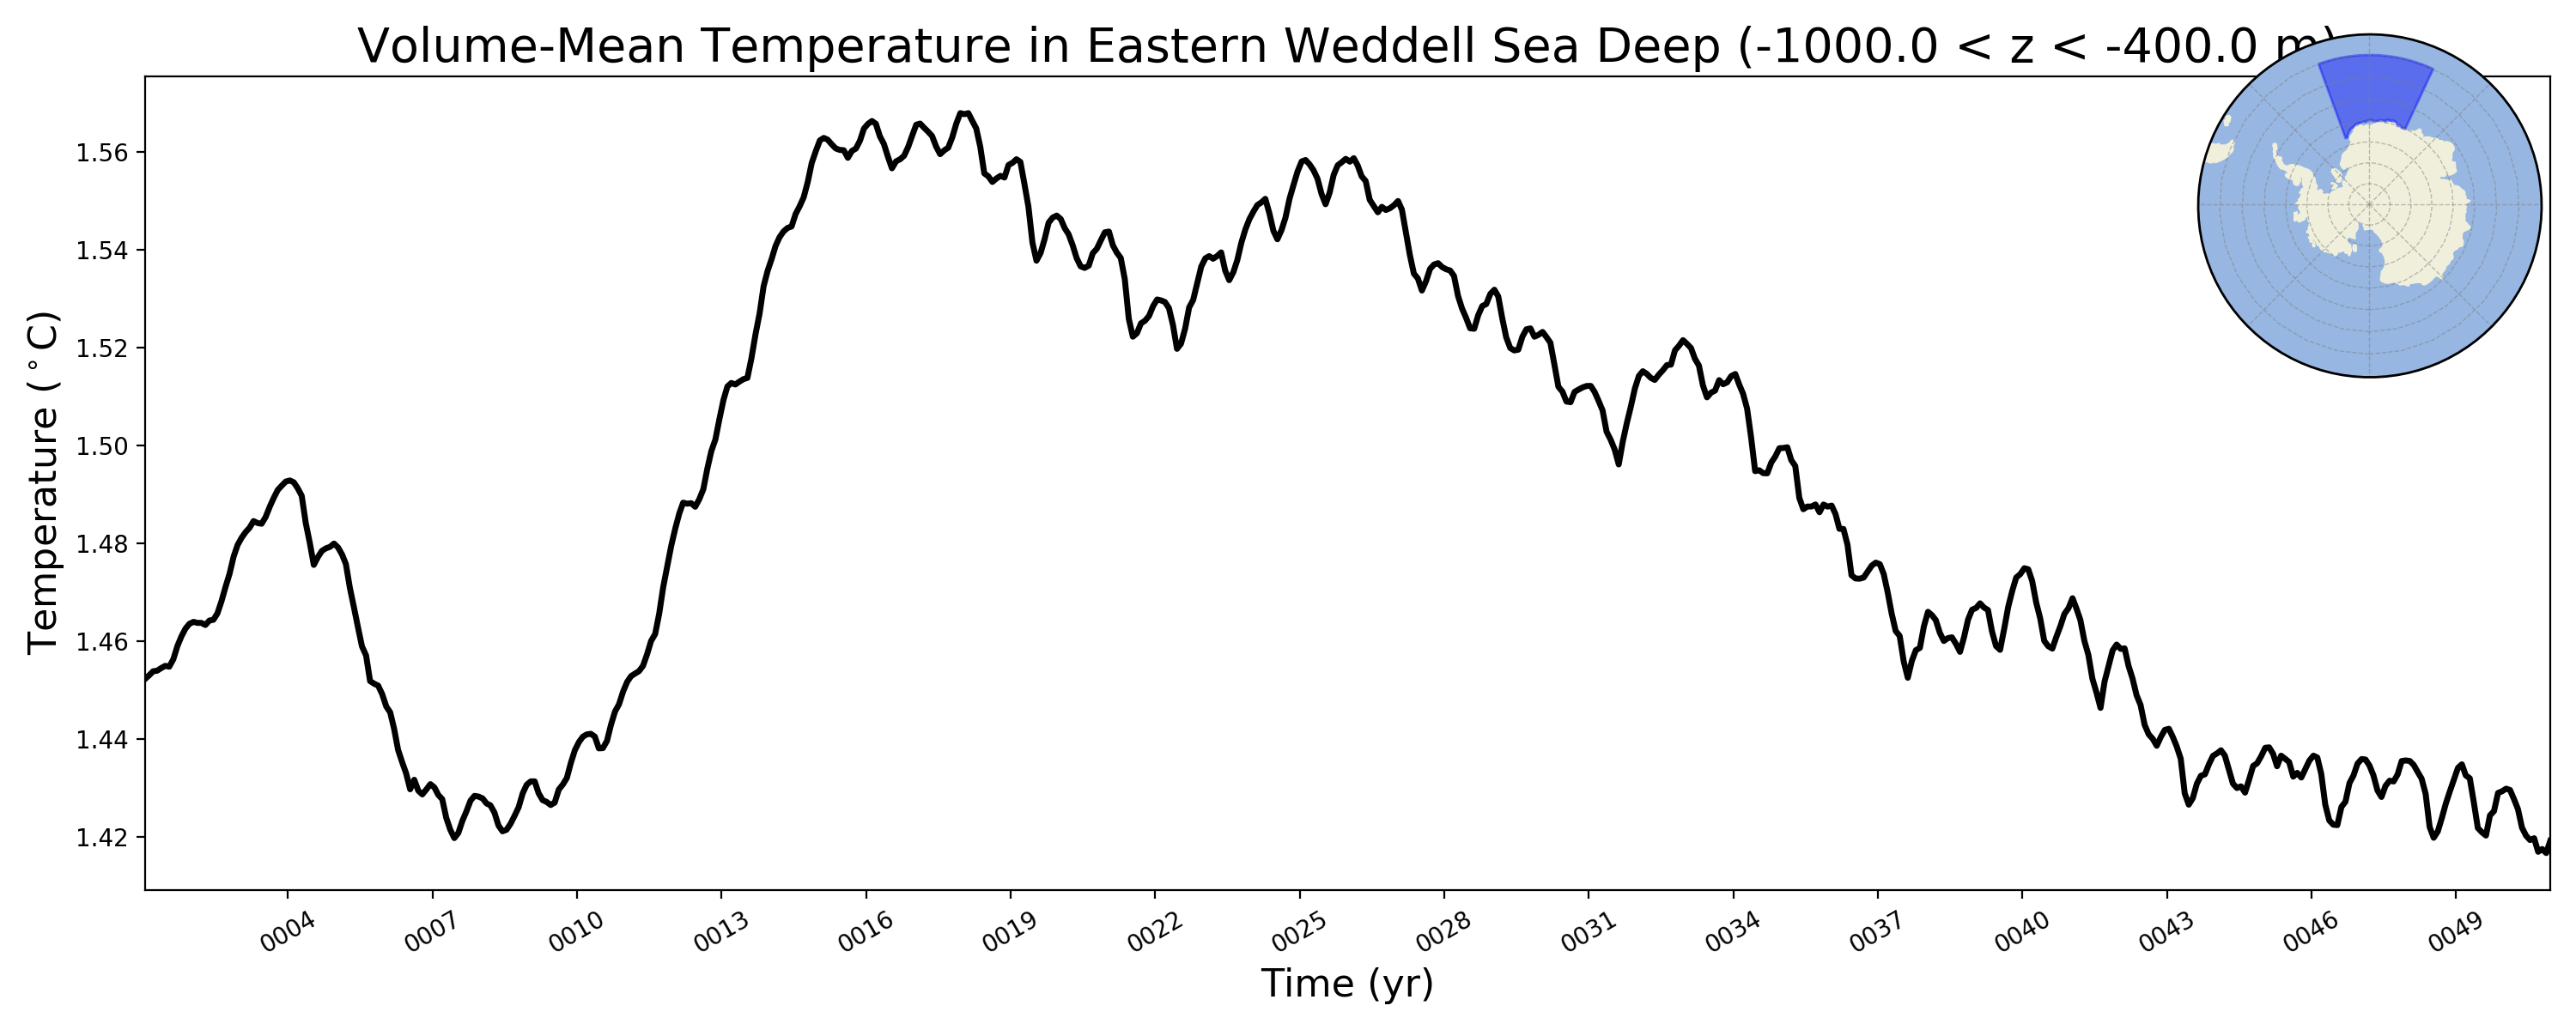
Eastern Weddell Sea Deep
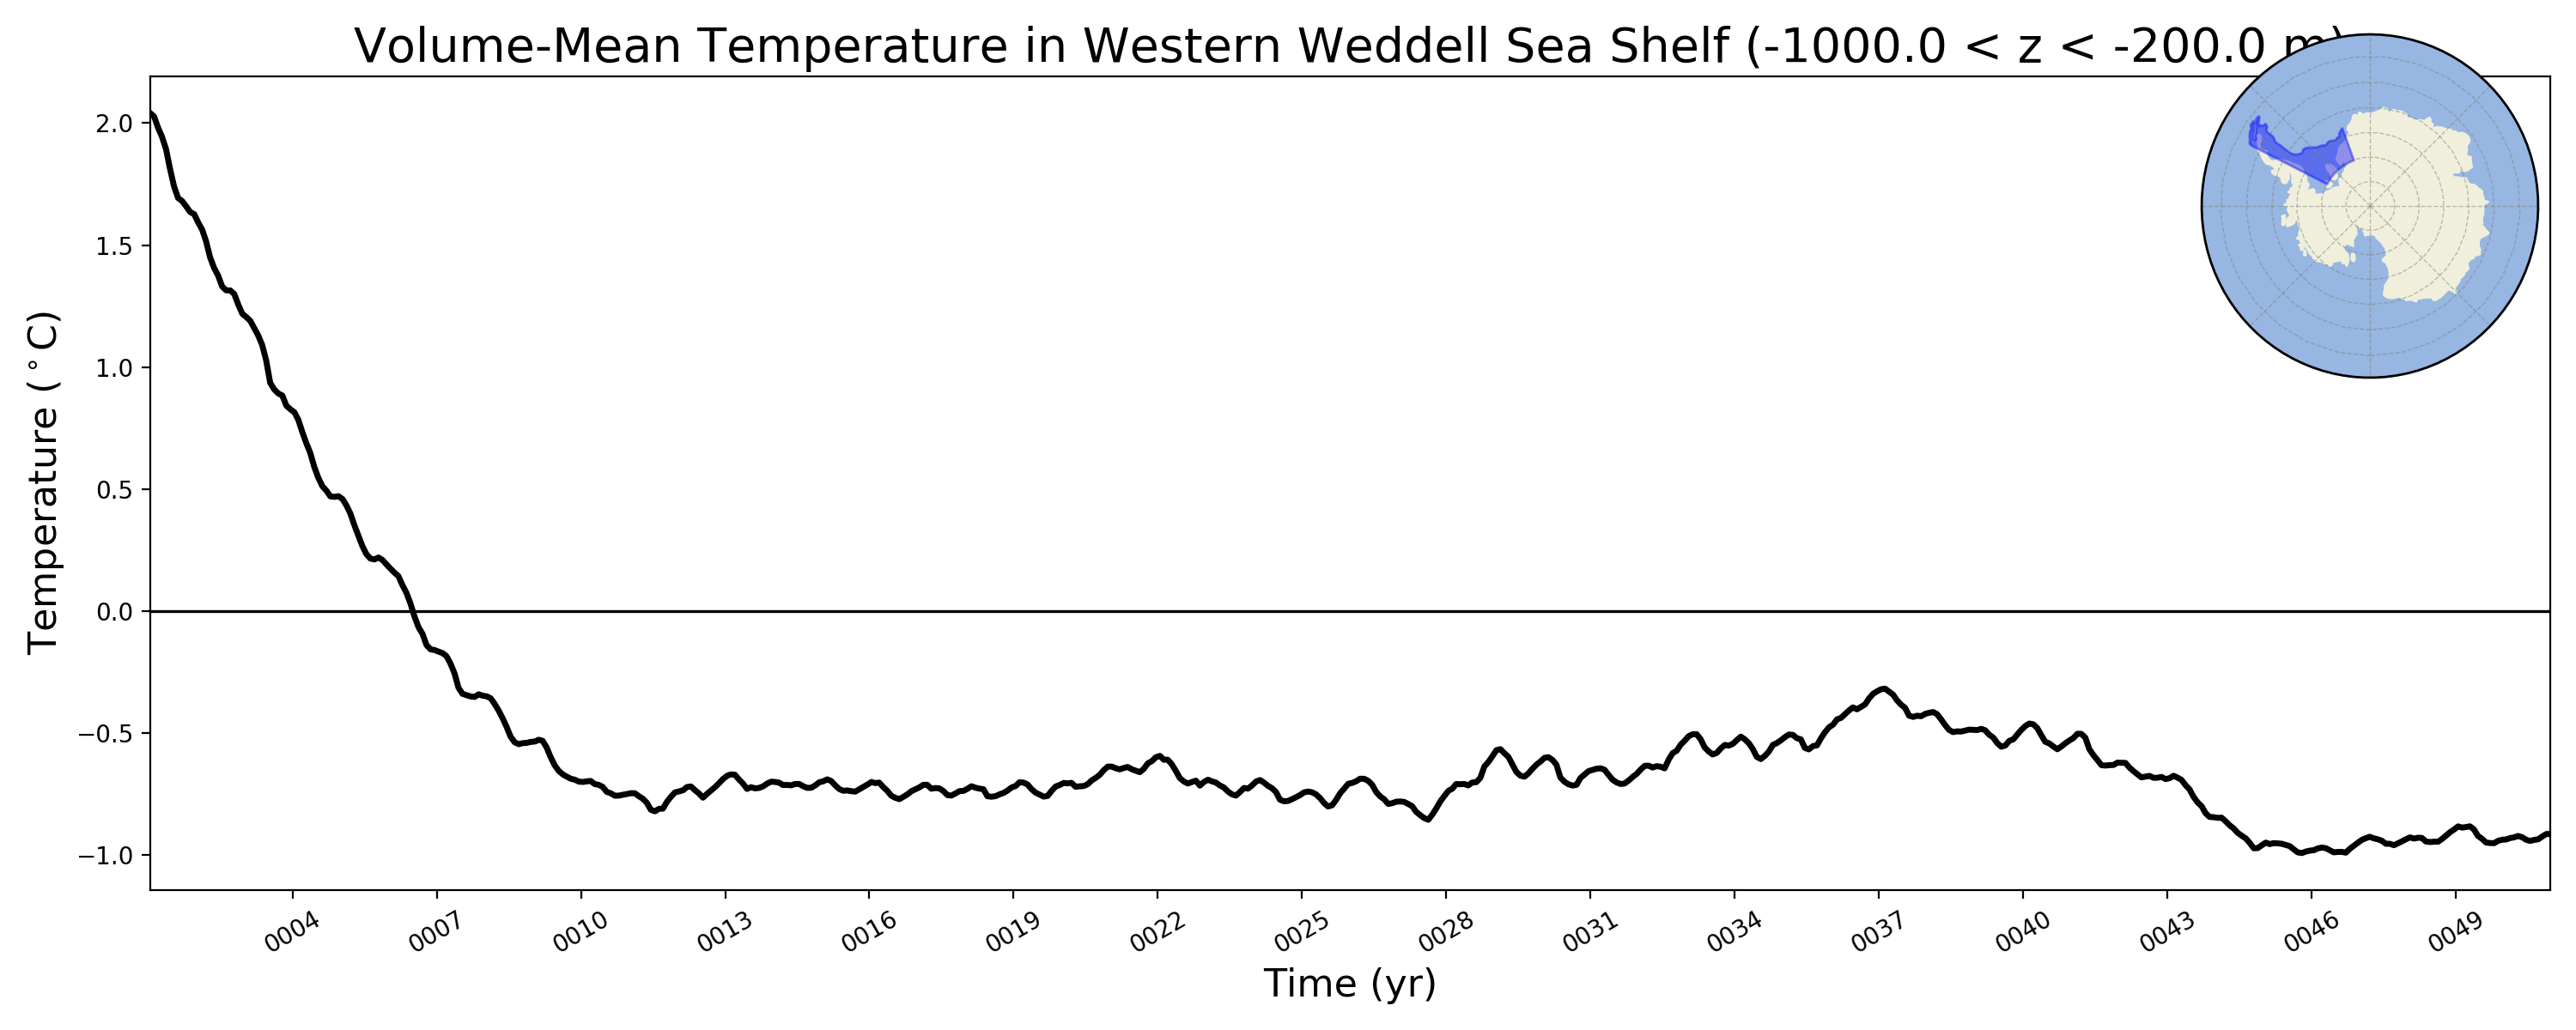
Western Weddell Sea Shelf
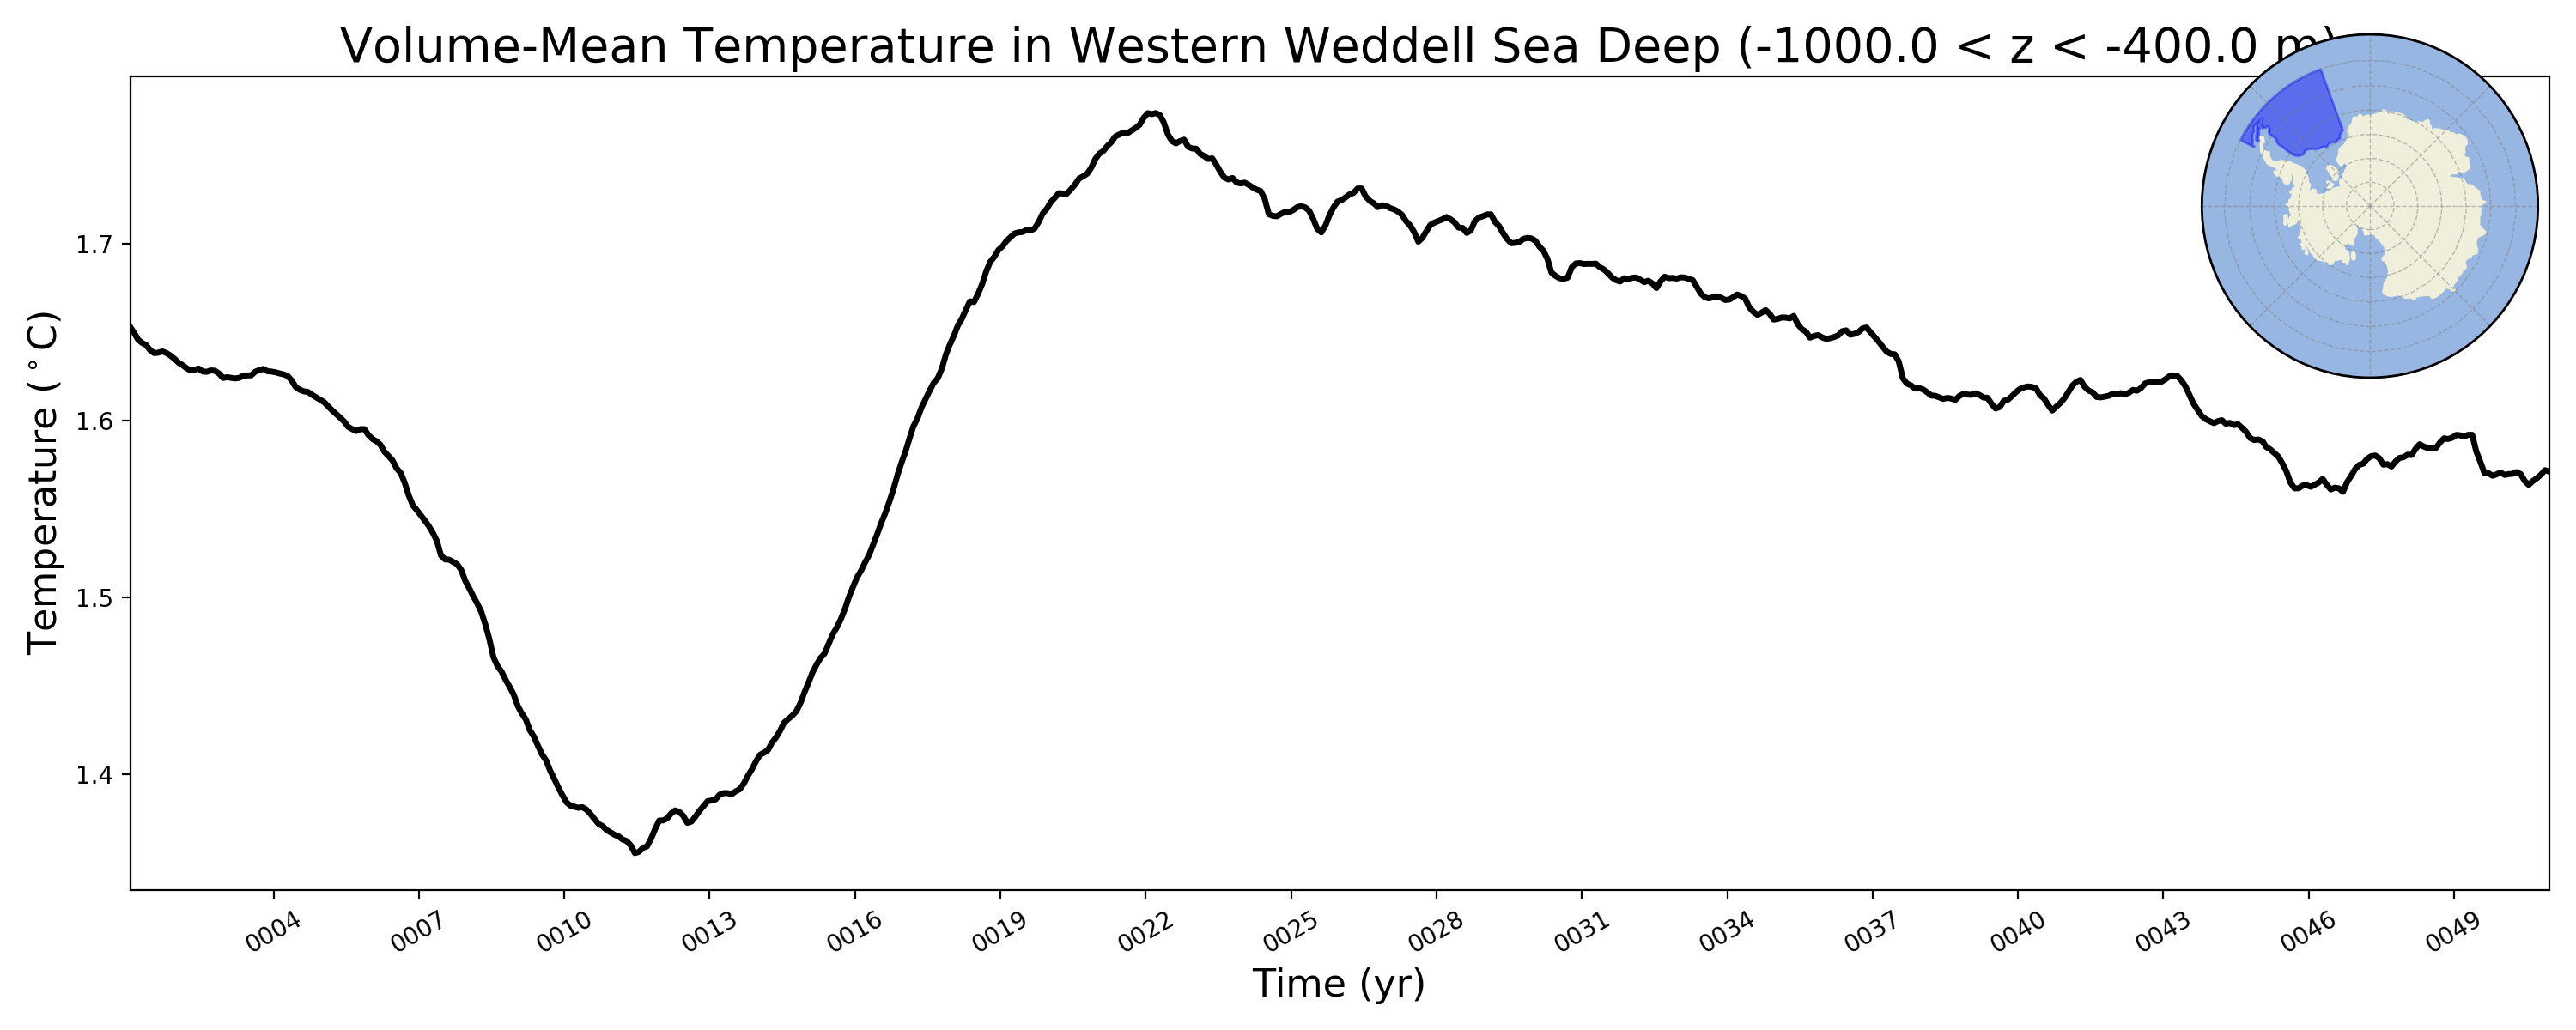
Western Weddell Sea Deep
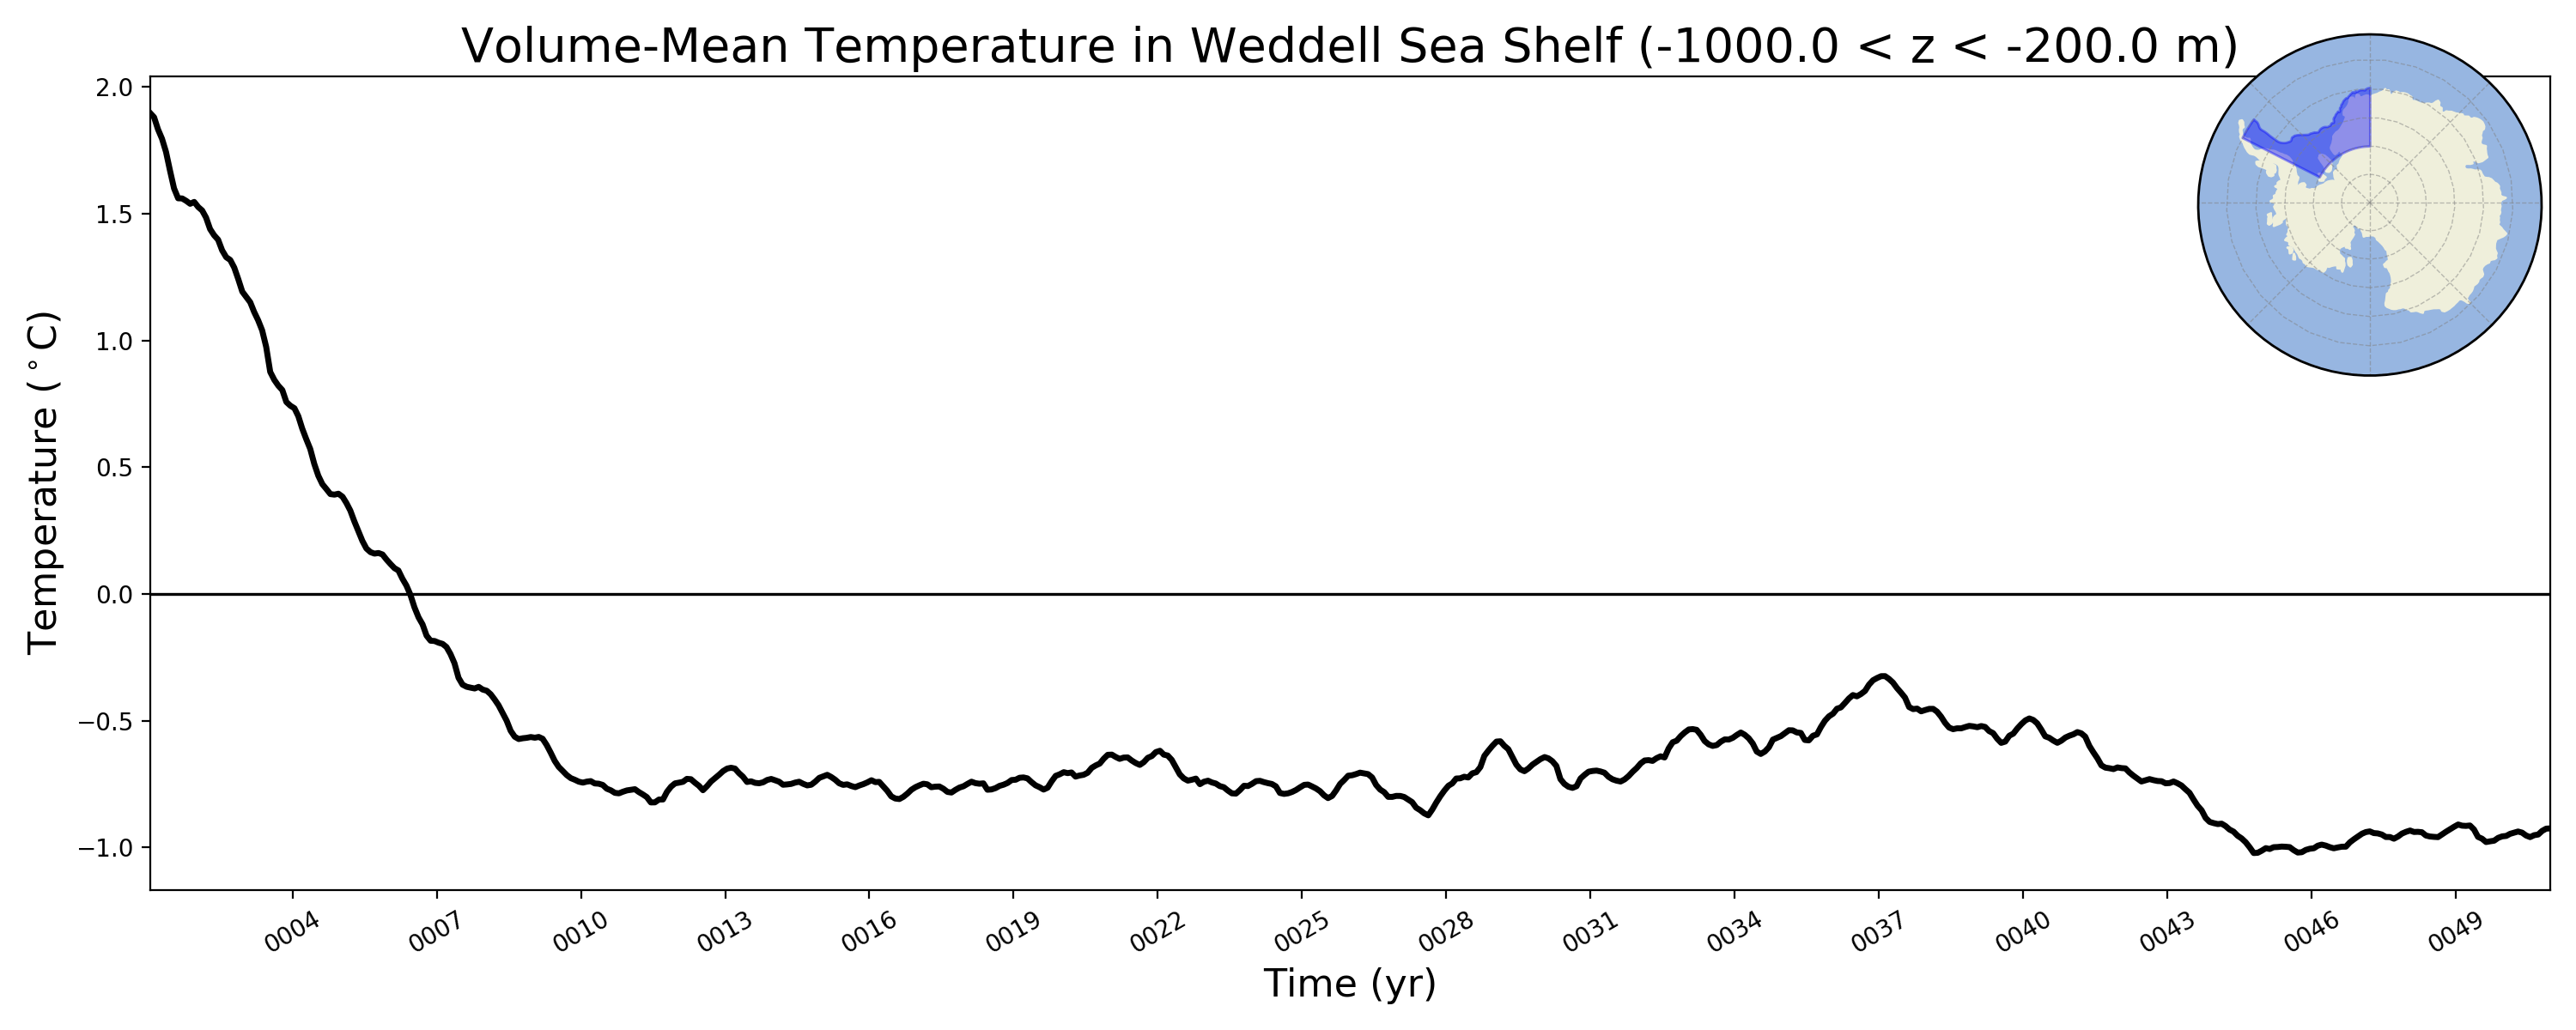
Weddell Sea Shelf
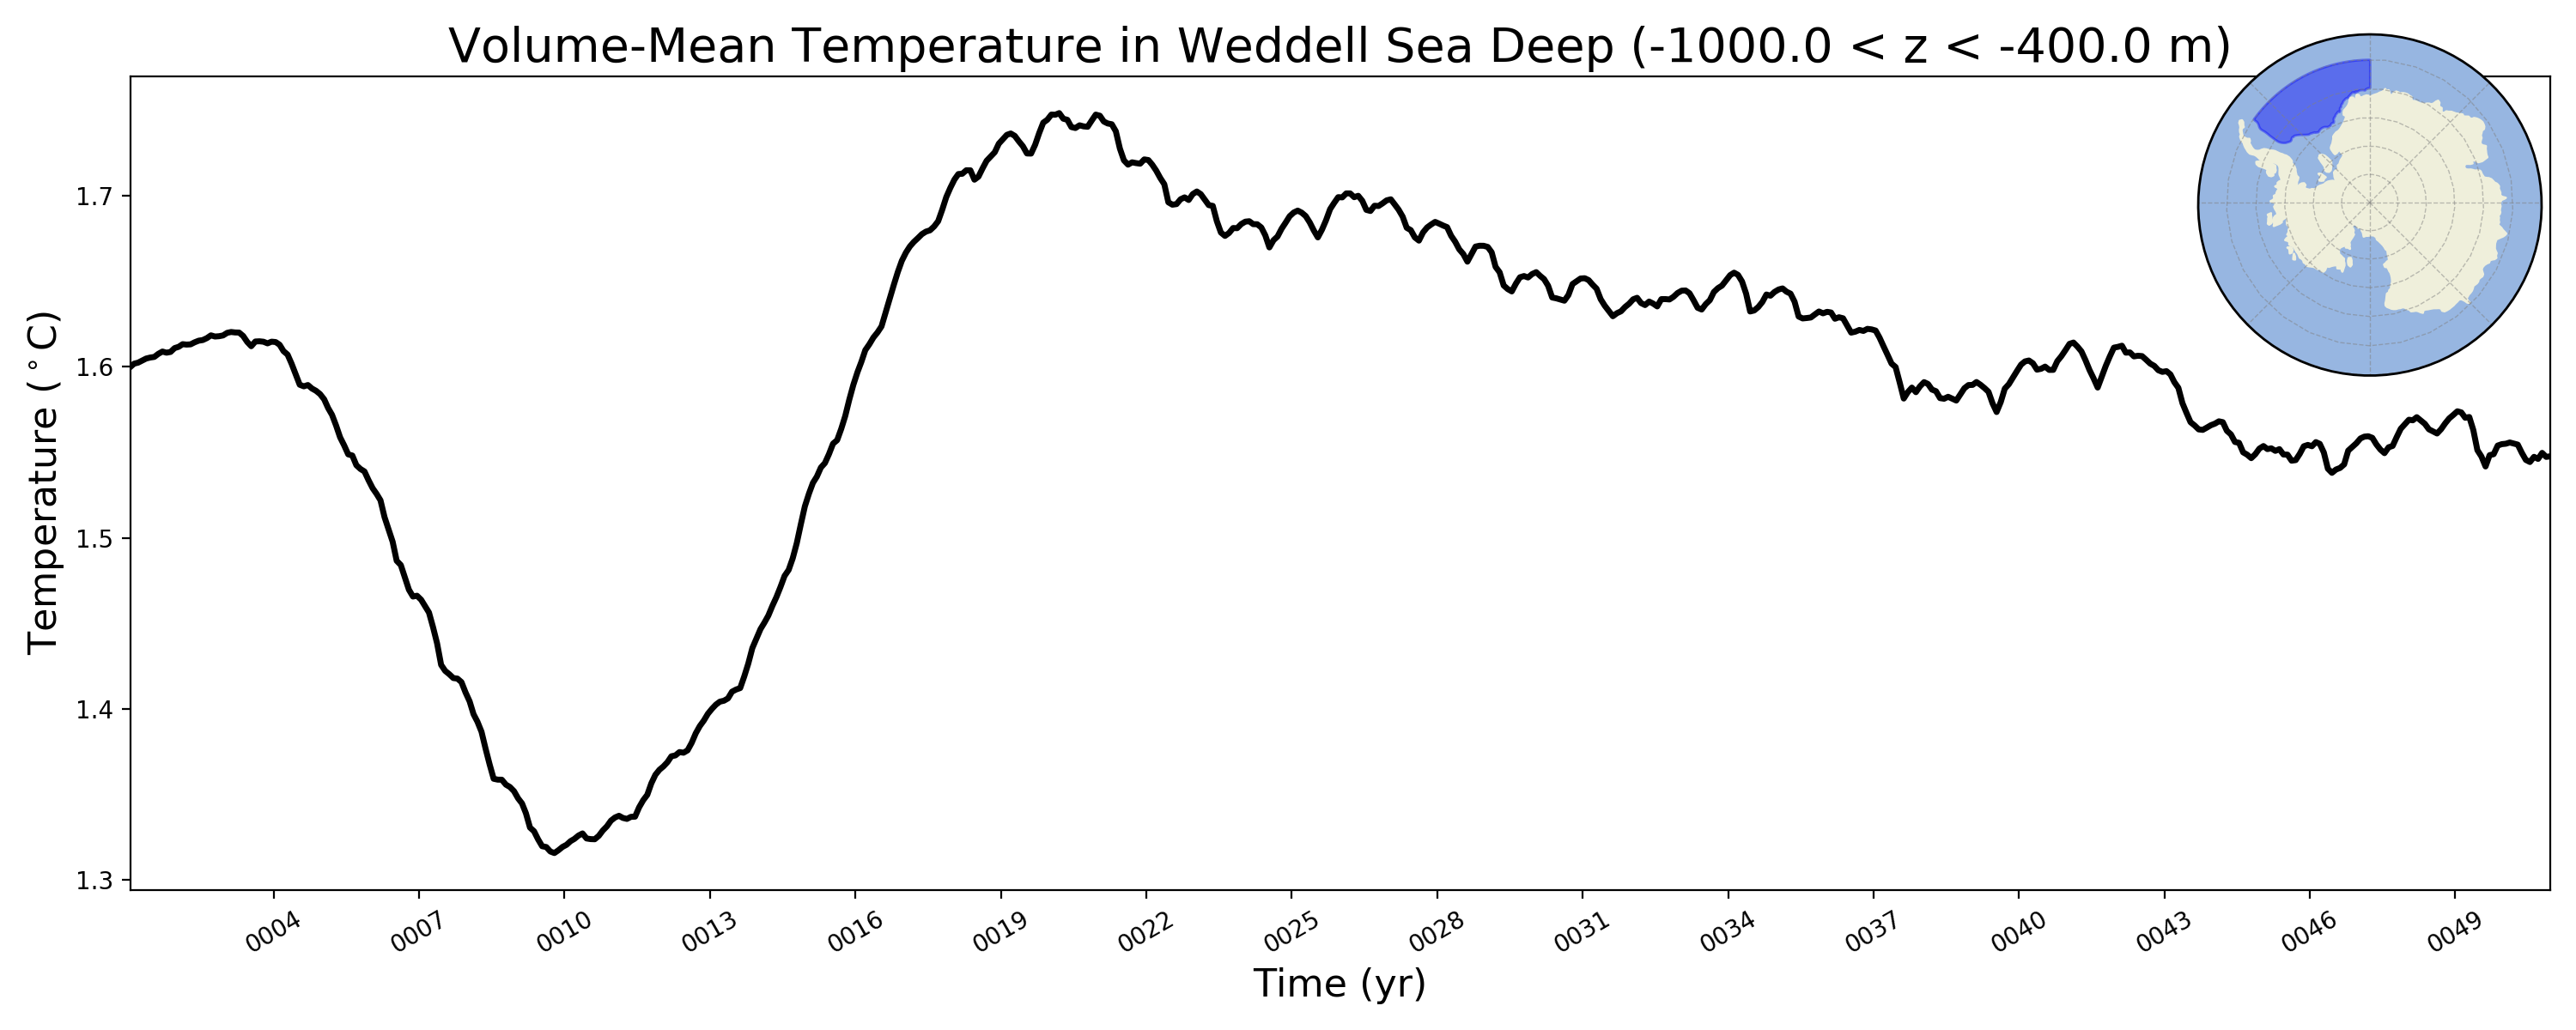
Weddell Sea Deep
Bellingshausen Sea Shelf
Bellingshausen Sea Deep
Amundsen Sea Shelf
Amundsen Sea Deep
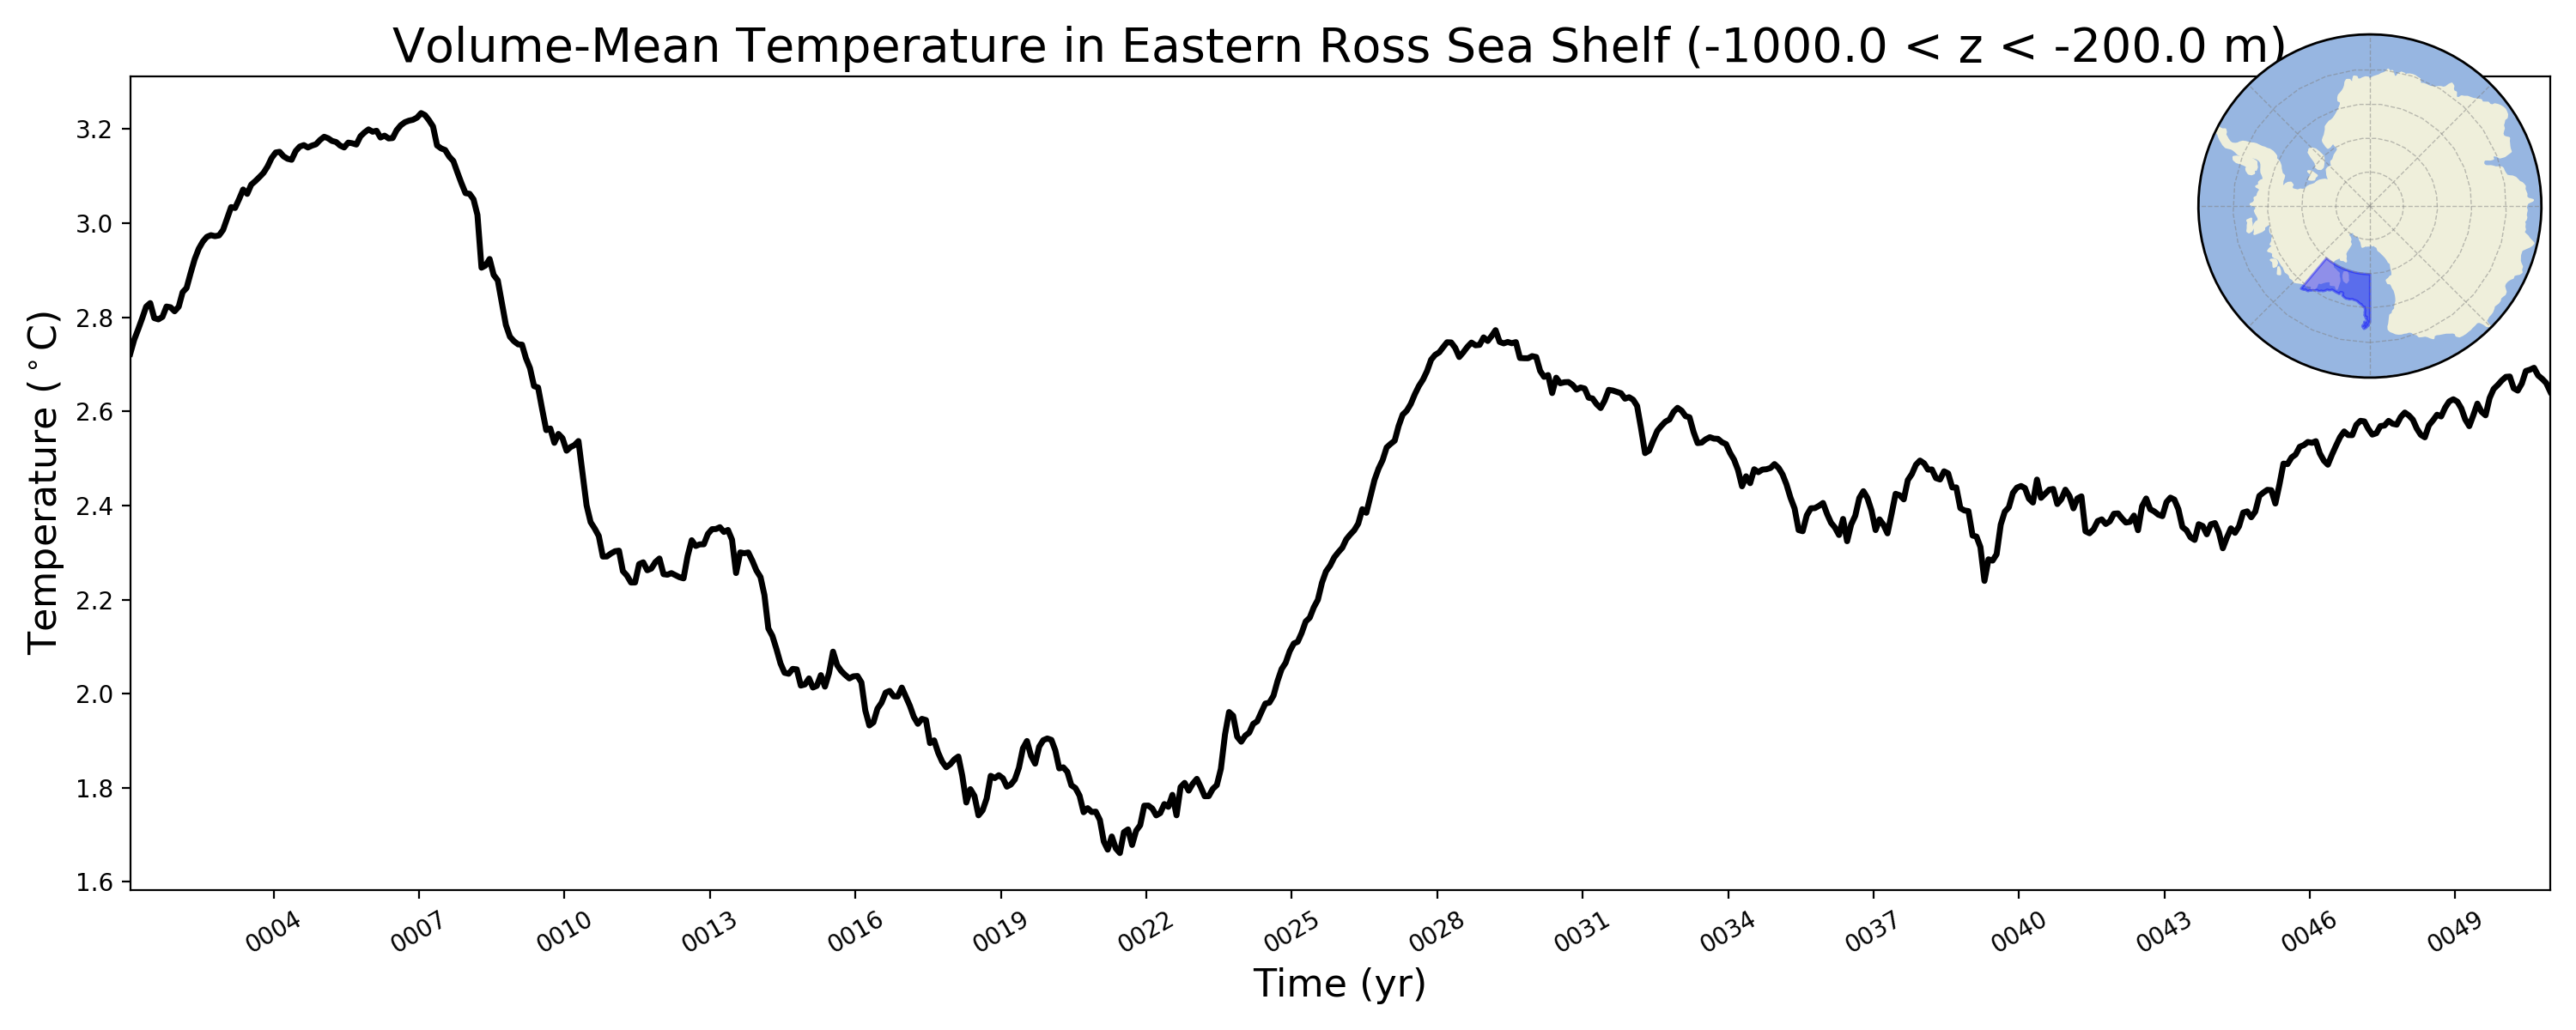
Eastern Ross Sea Shelf
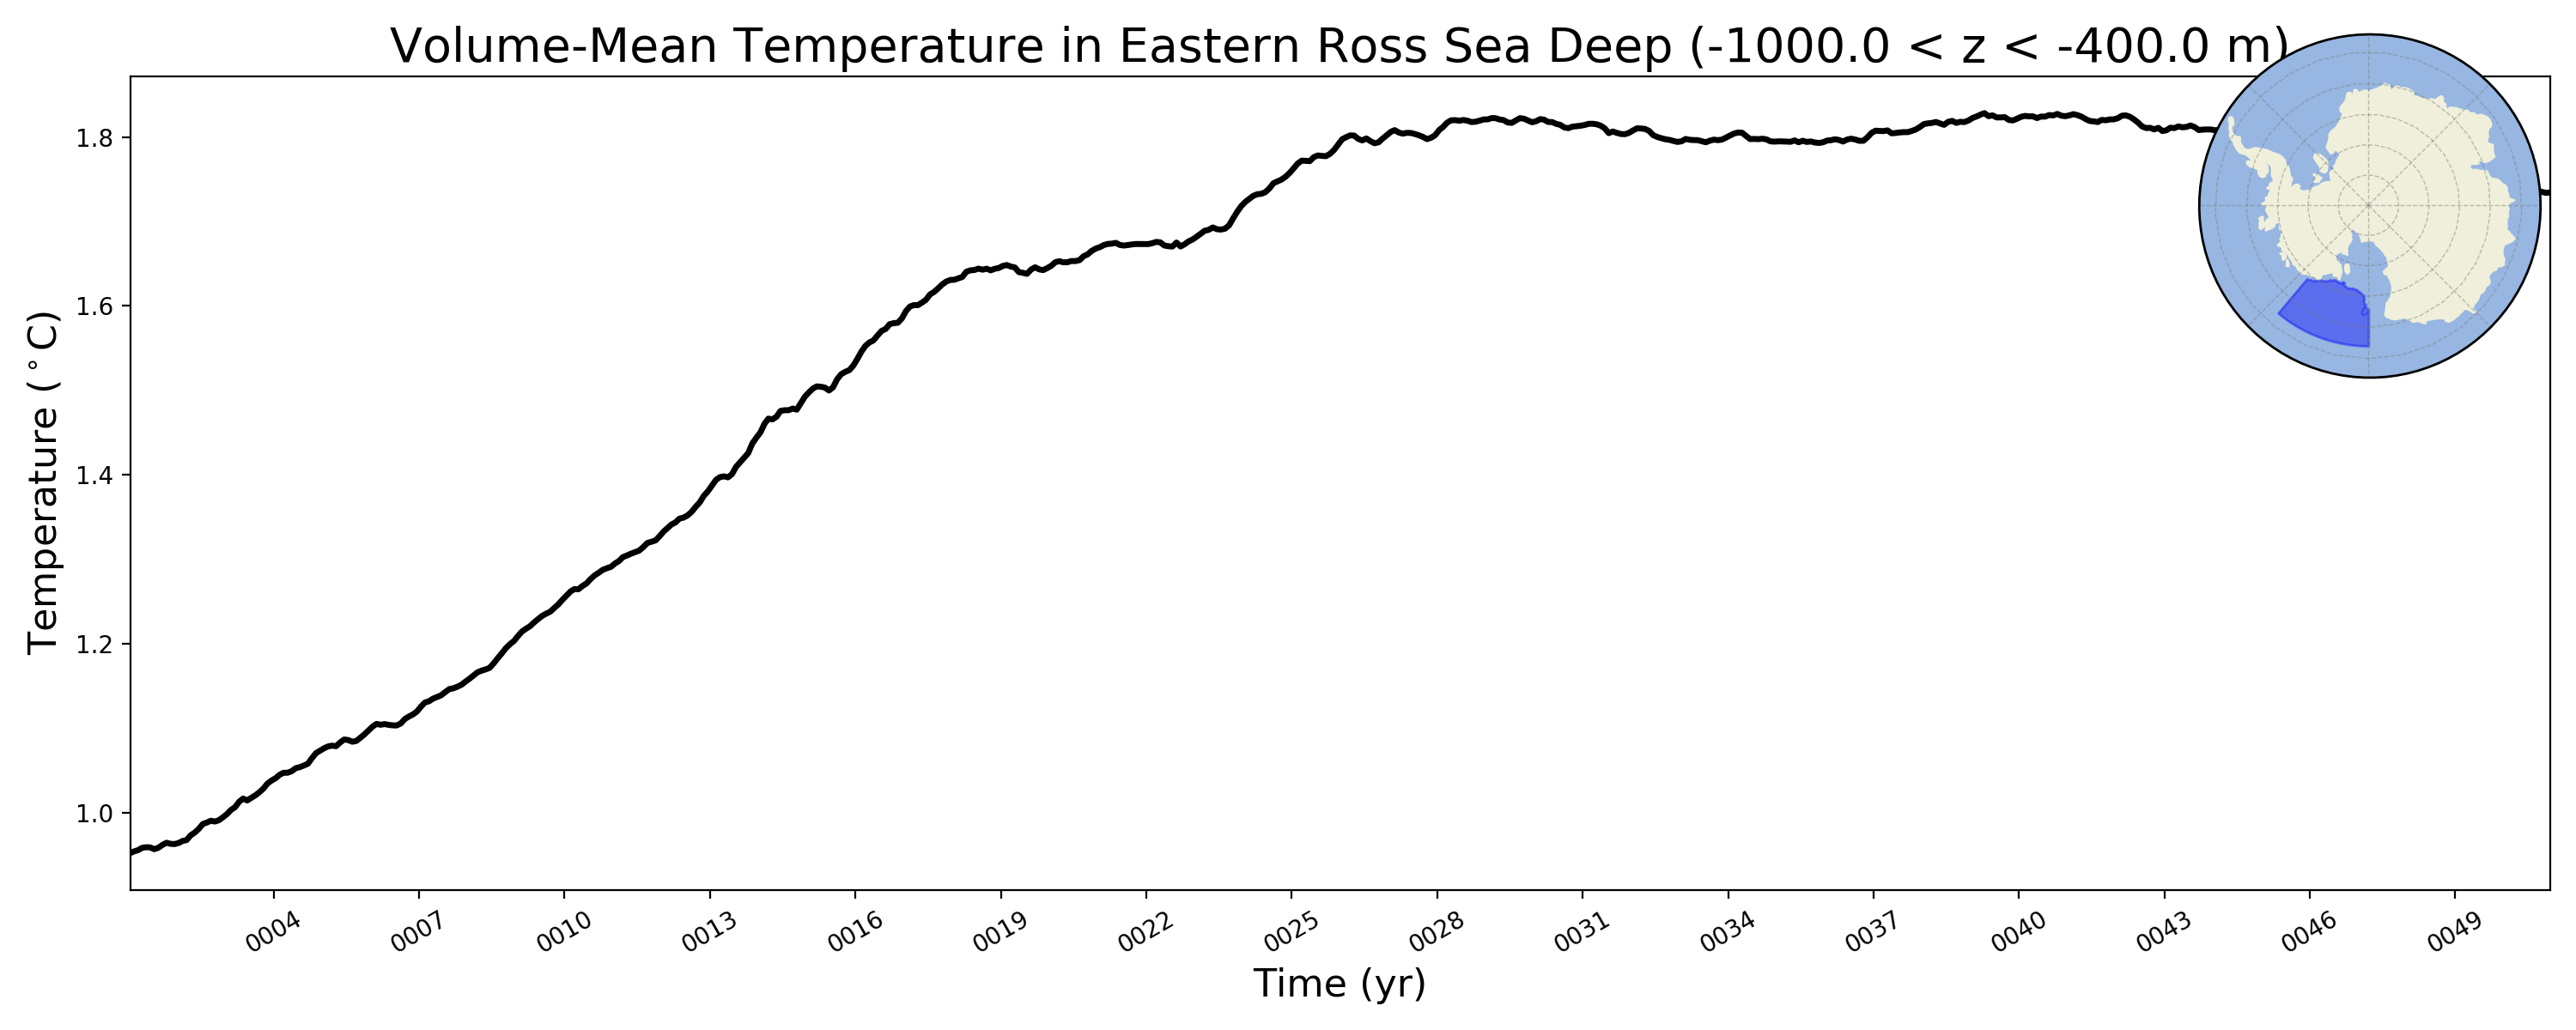
Eastern Ross Sea Deep
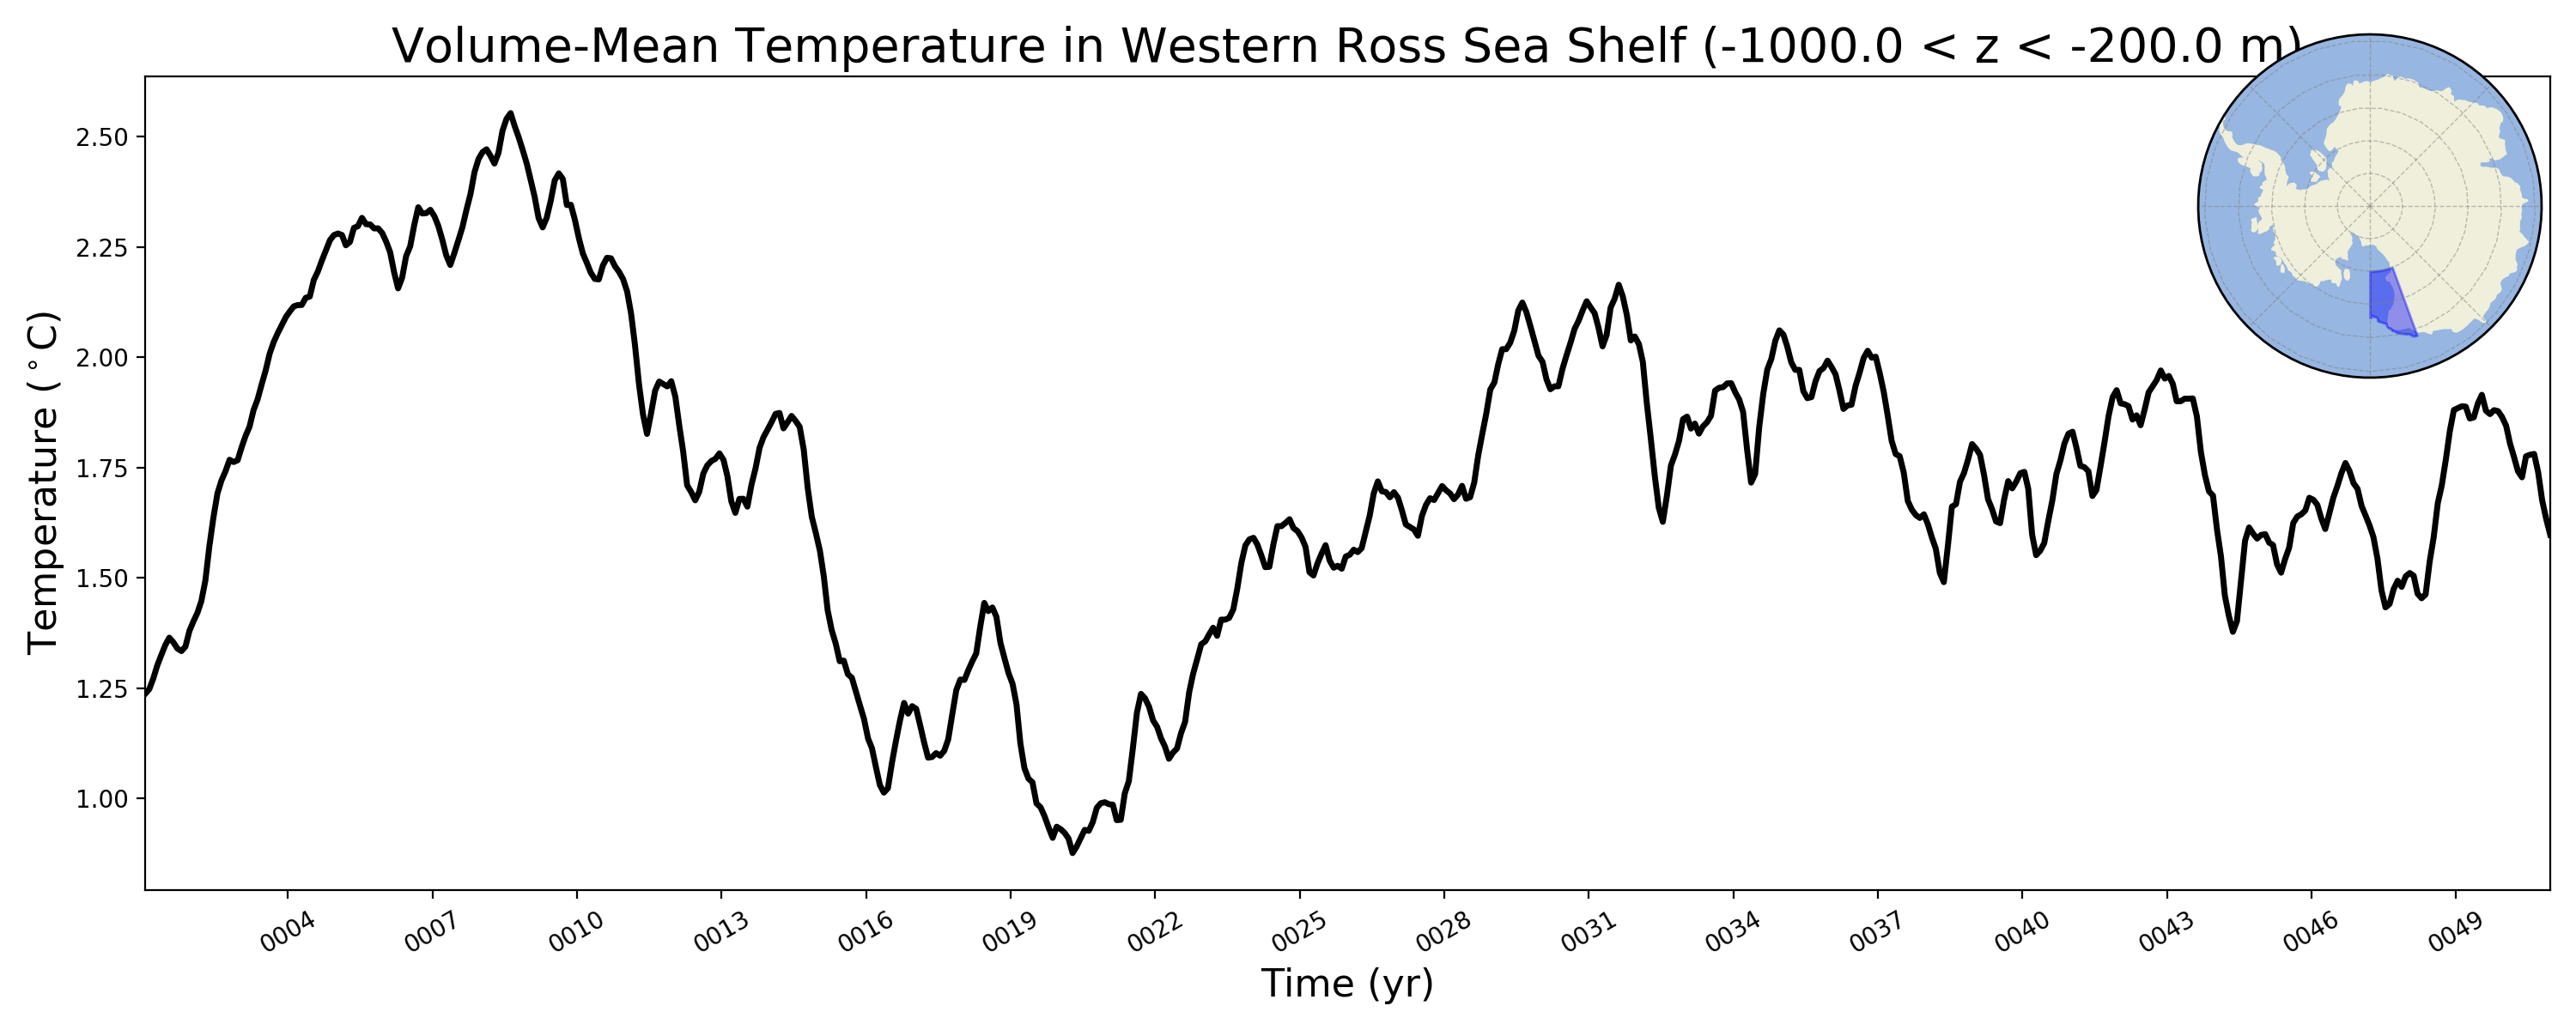
Western Ross Sea Shelf
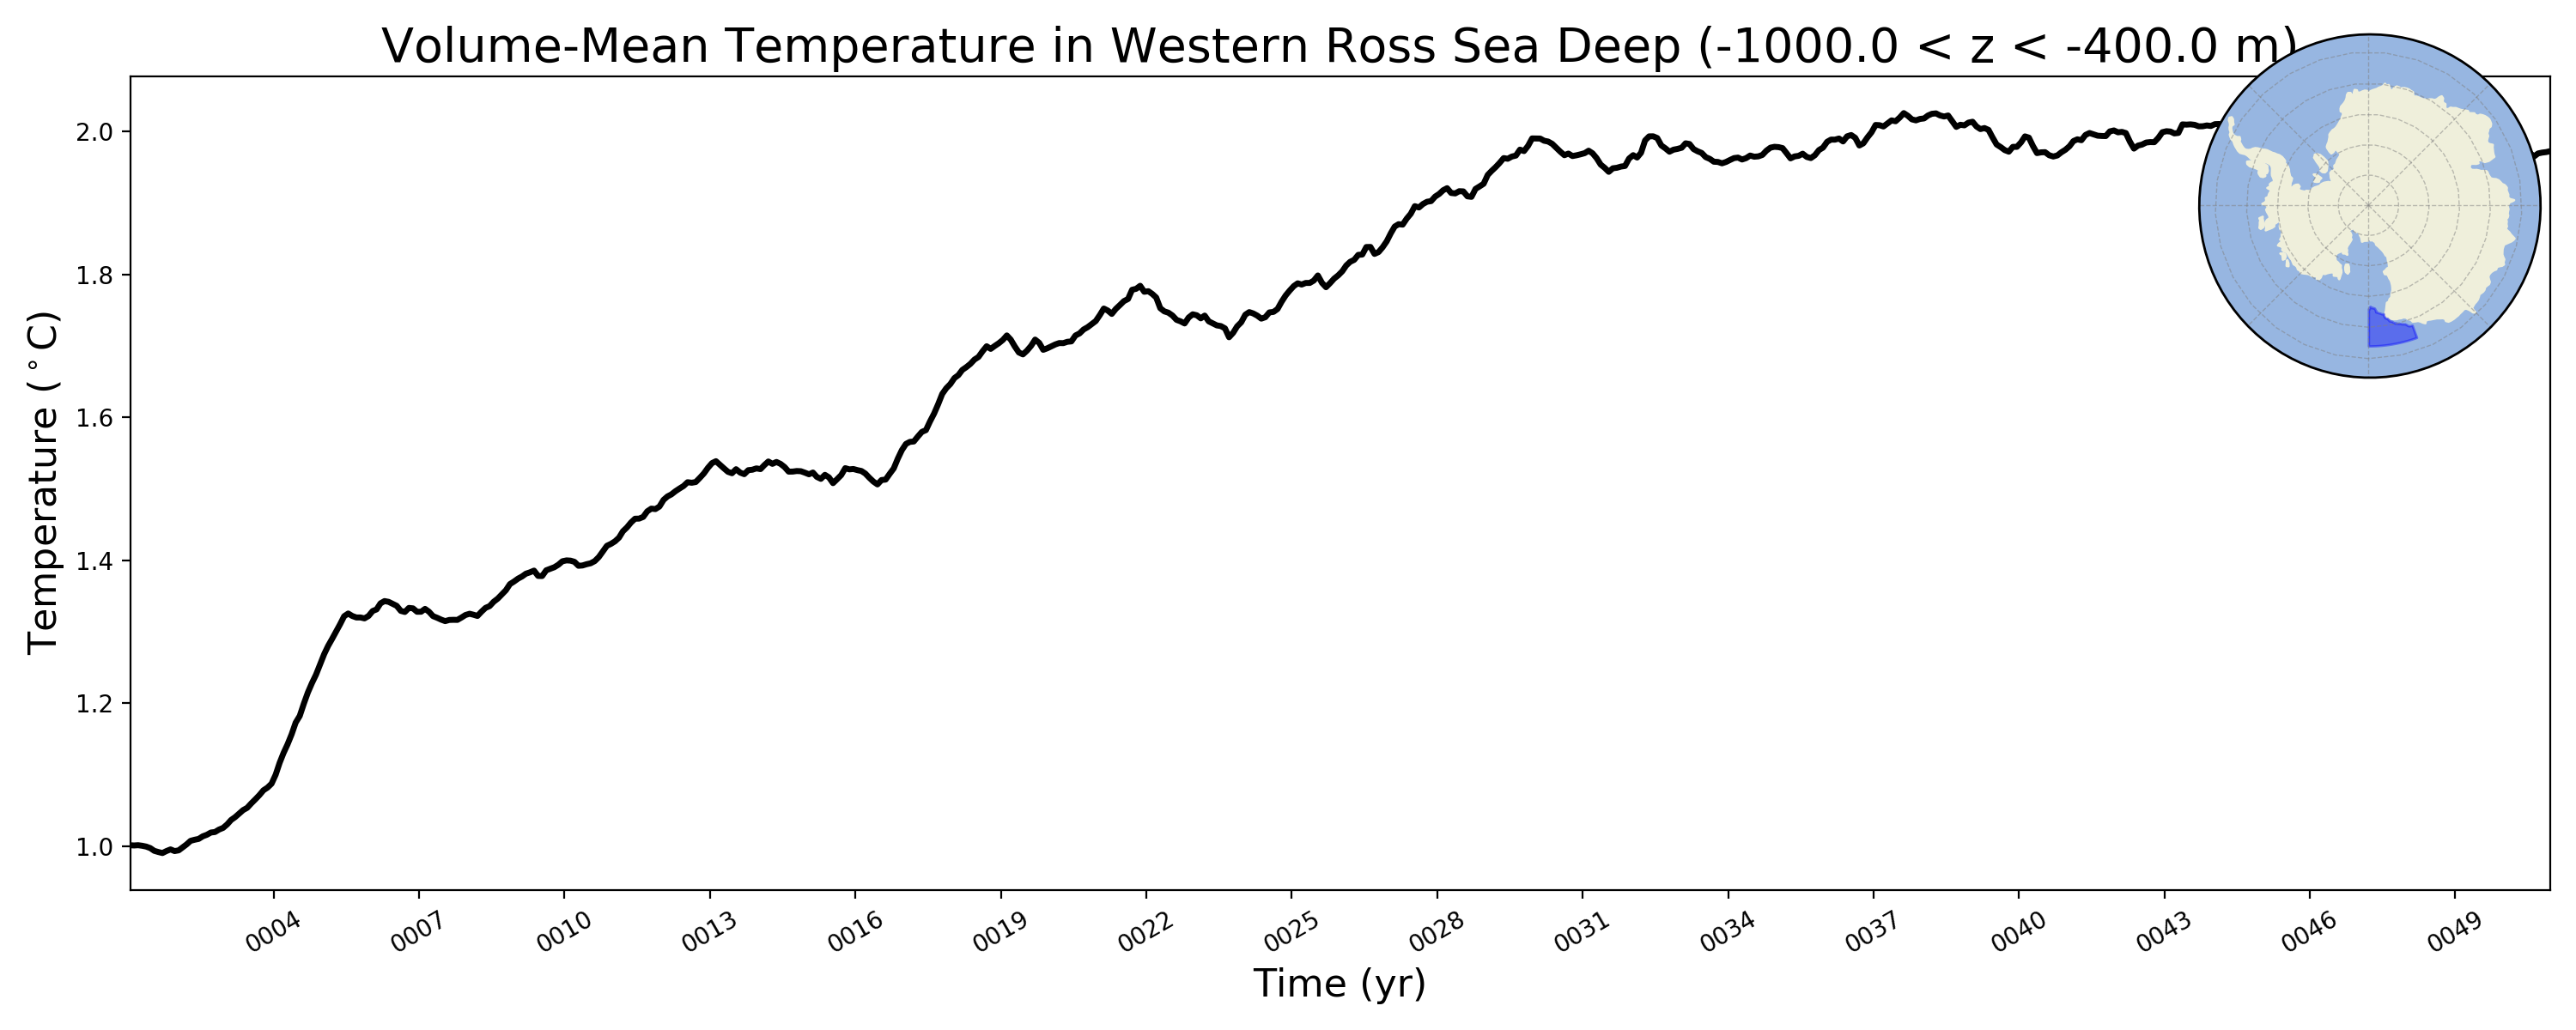
Western Ross Sea Deep
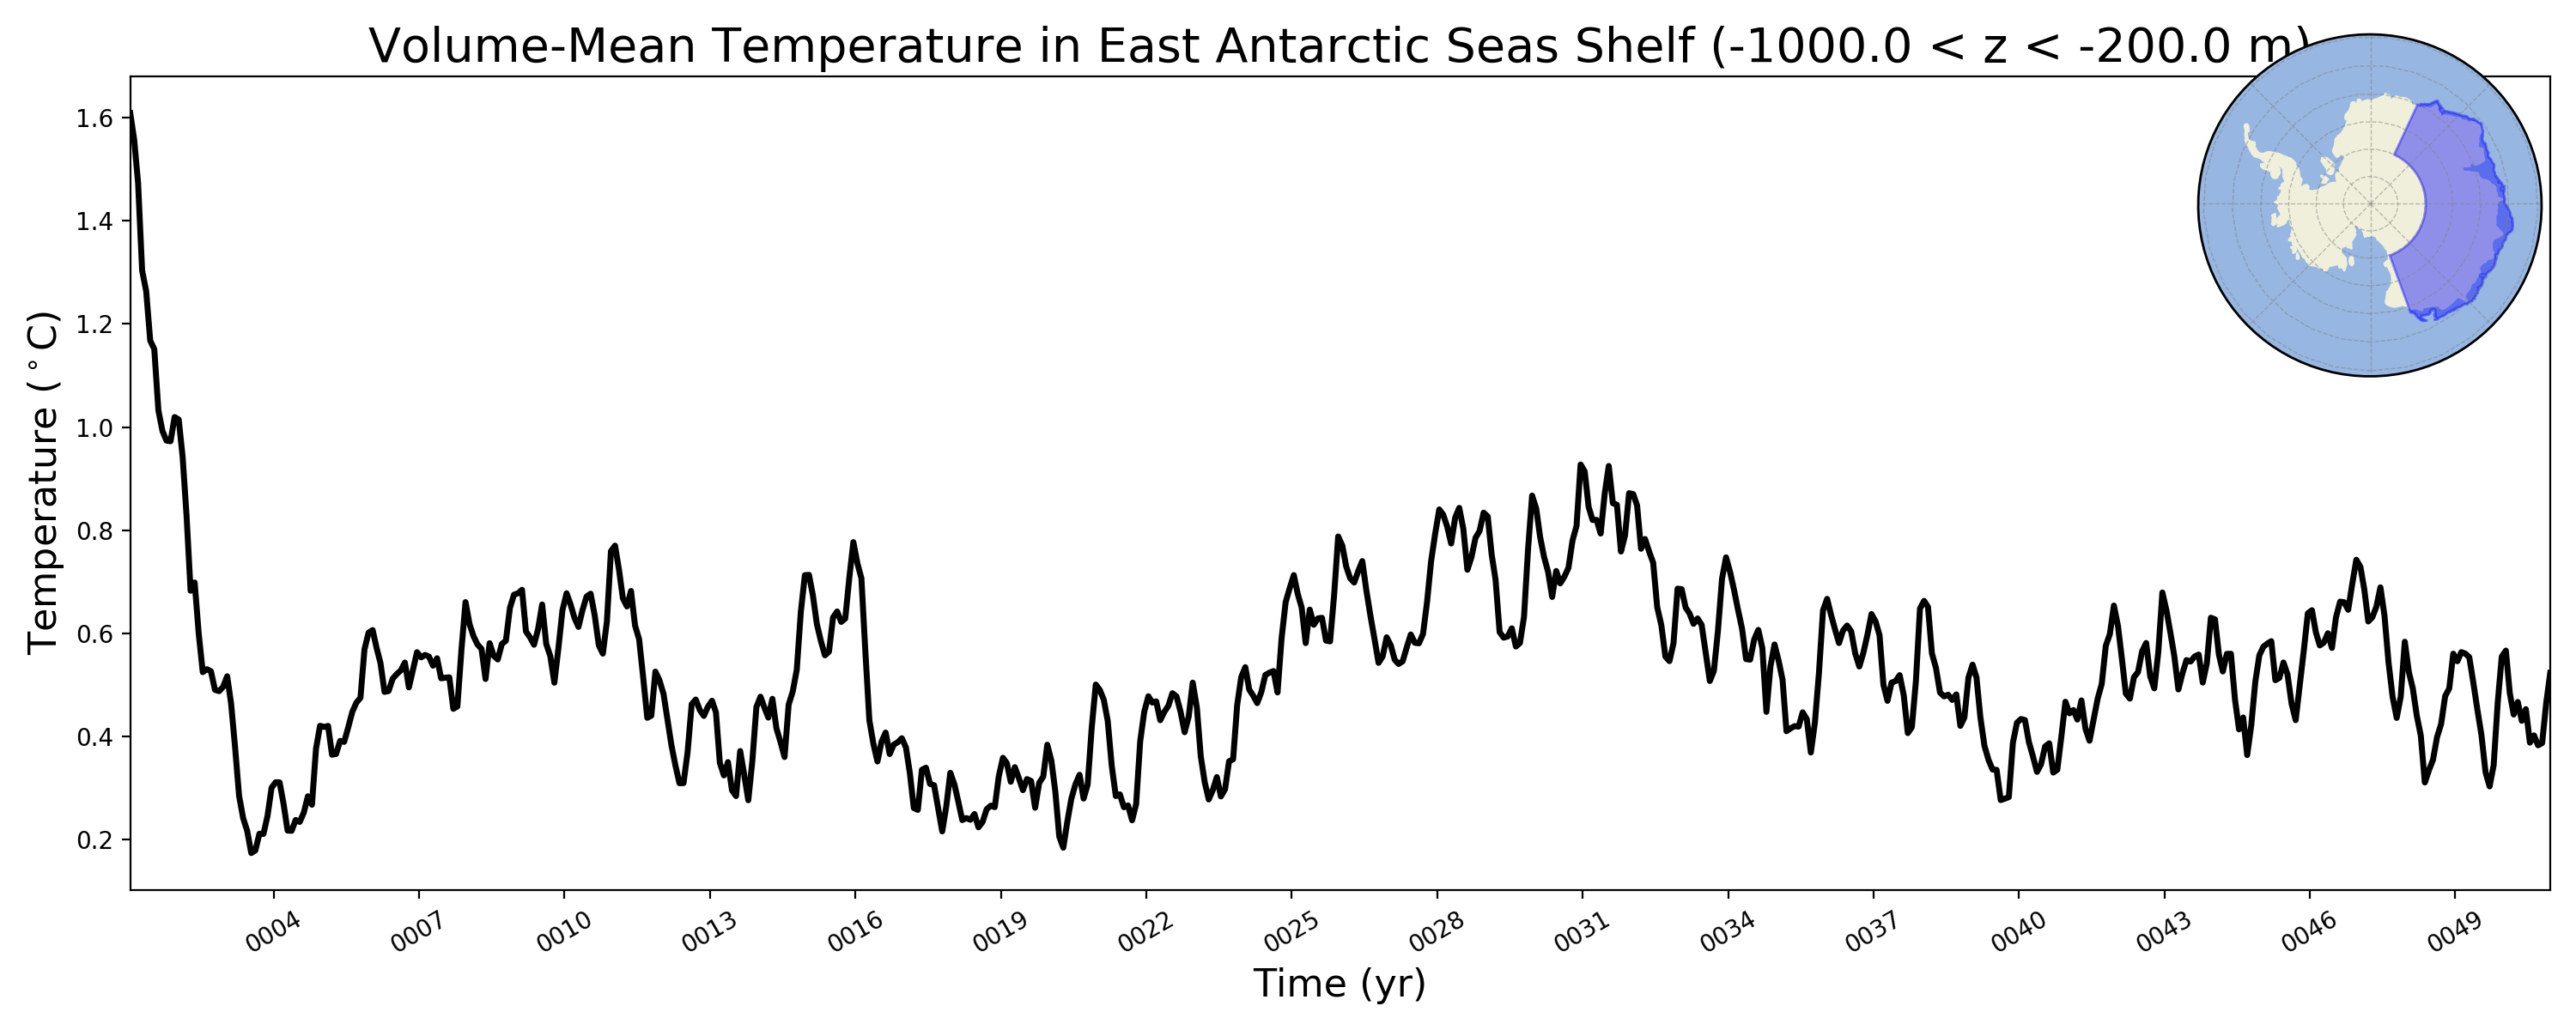
East Antarctic Seas Shelf
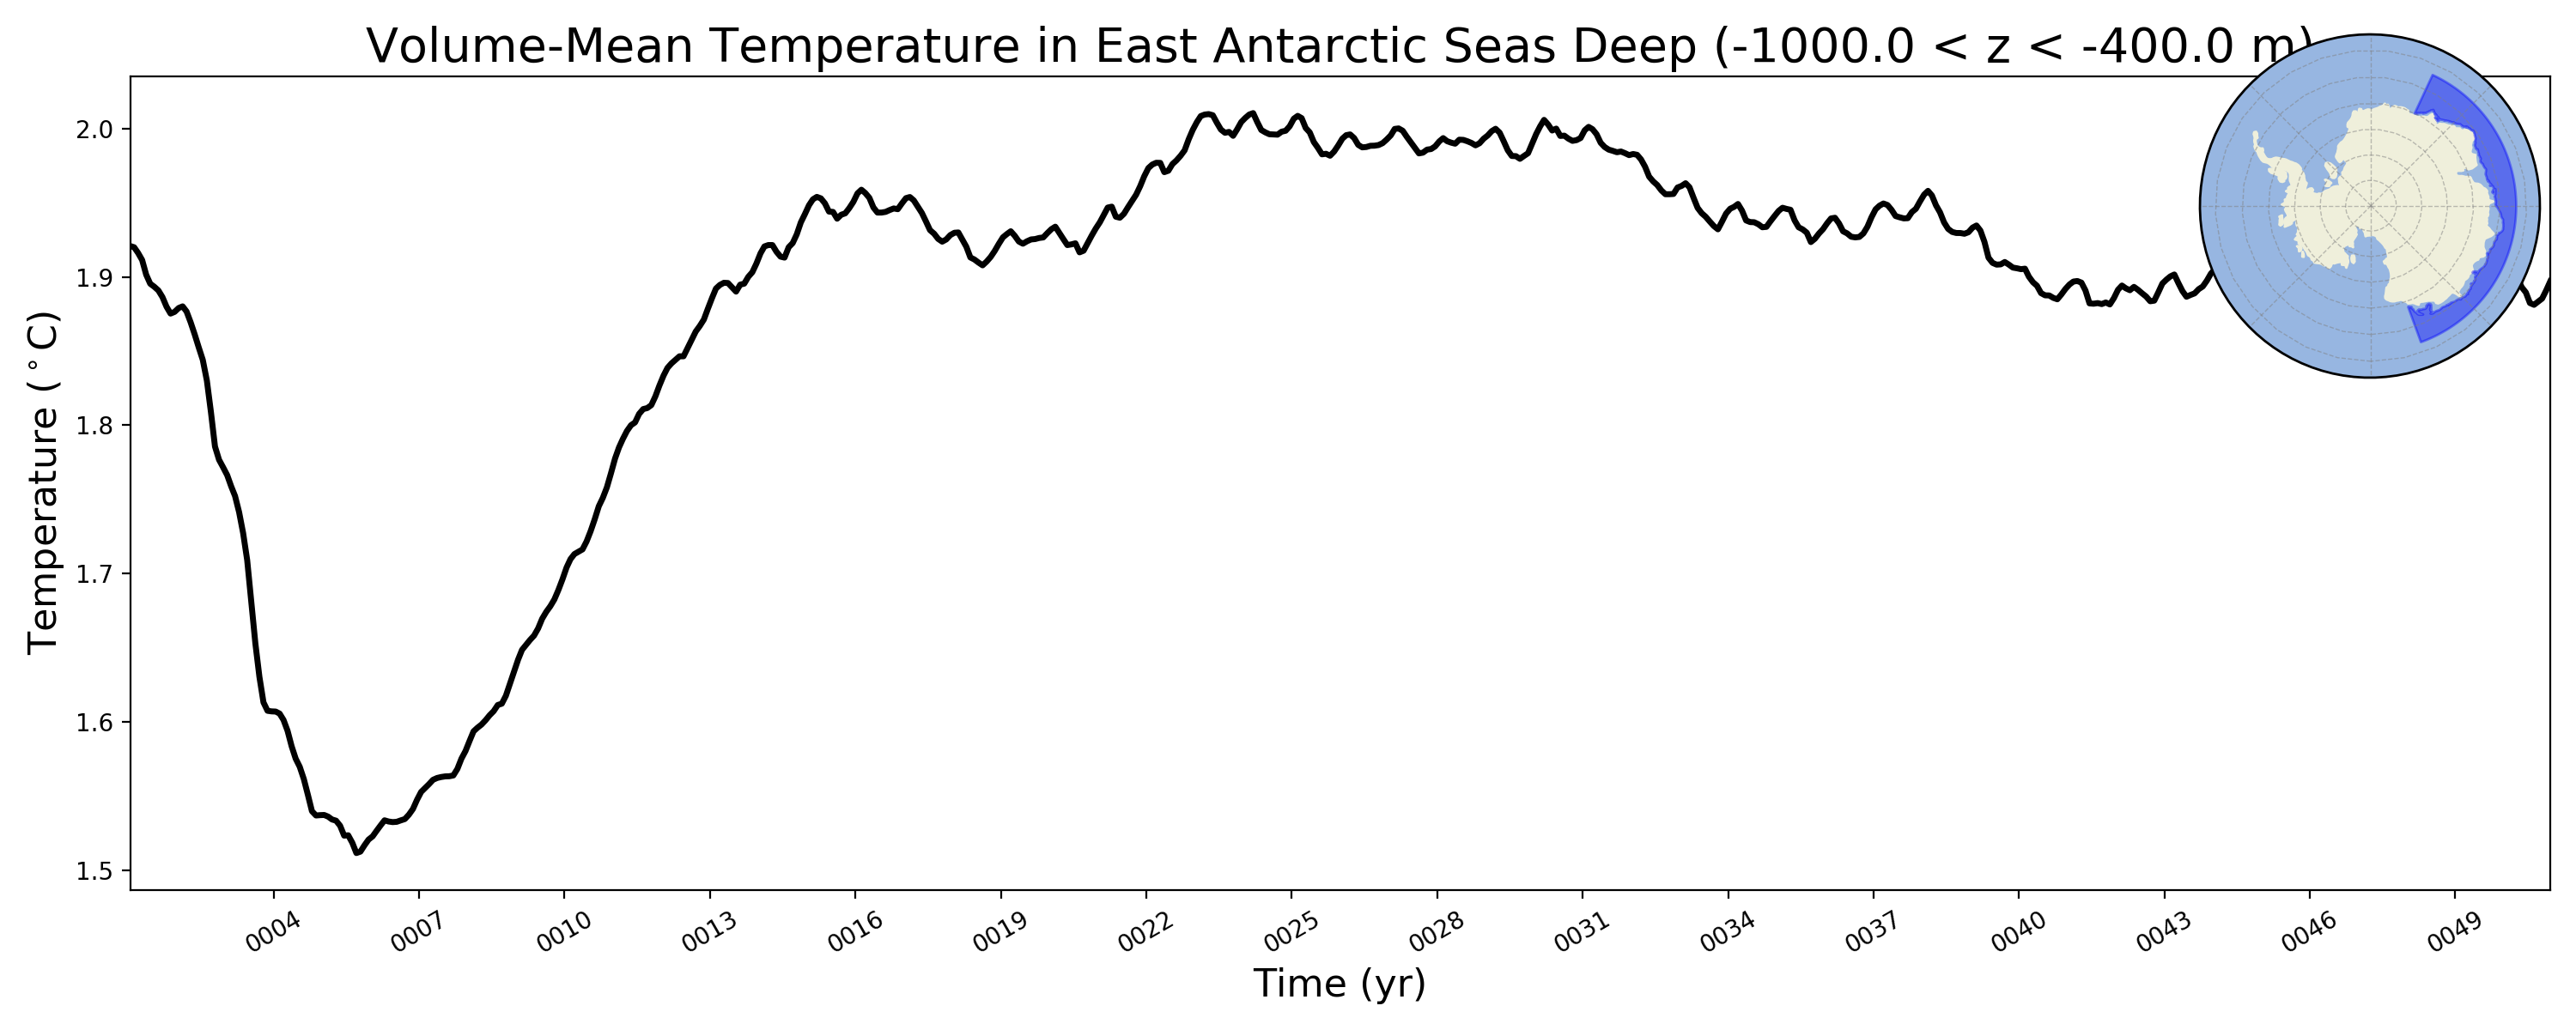
East Antarctic Seas Deep
Salinity
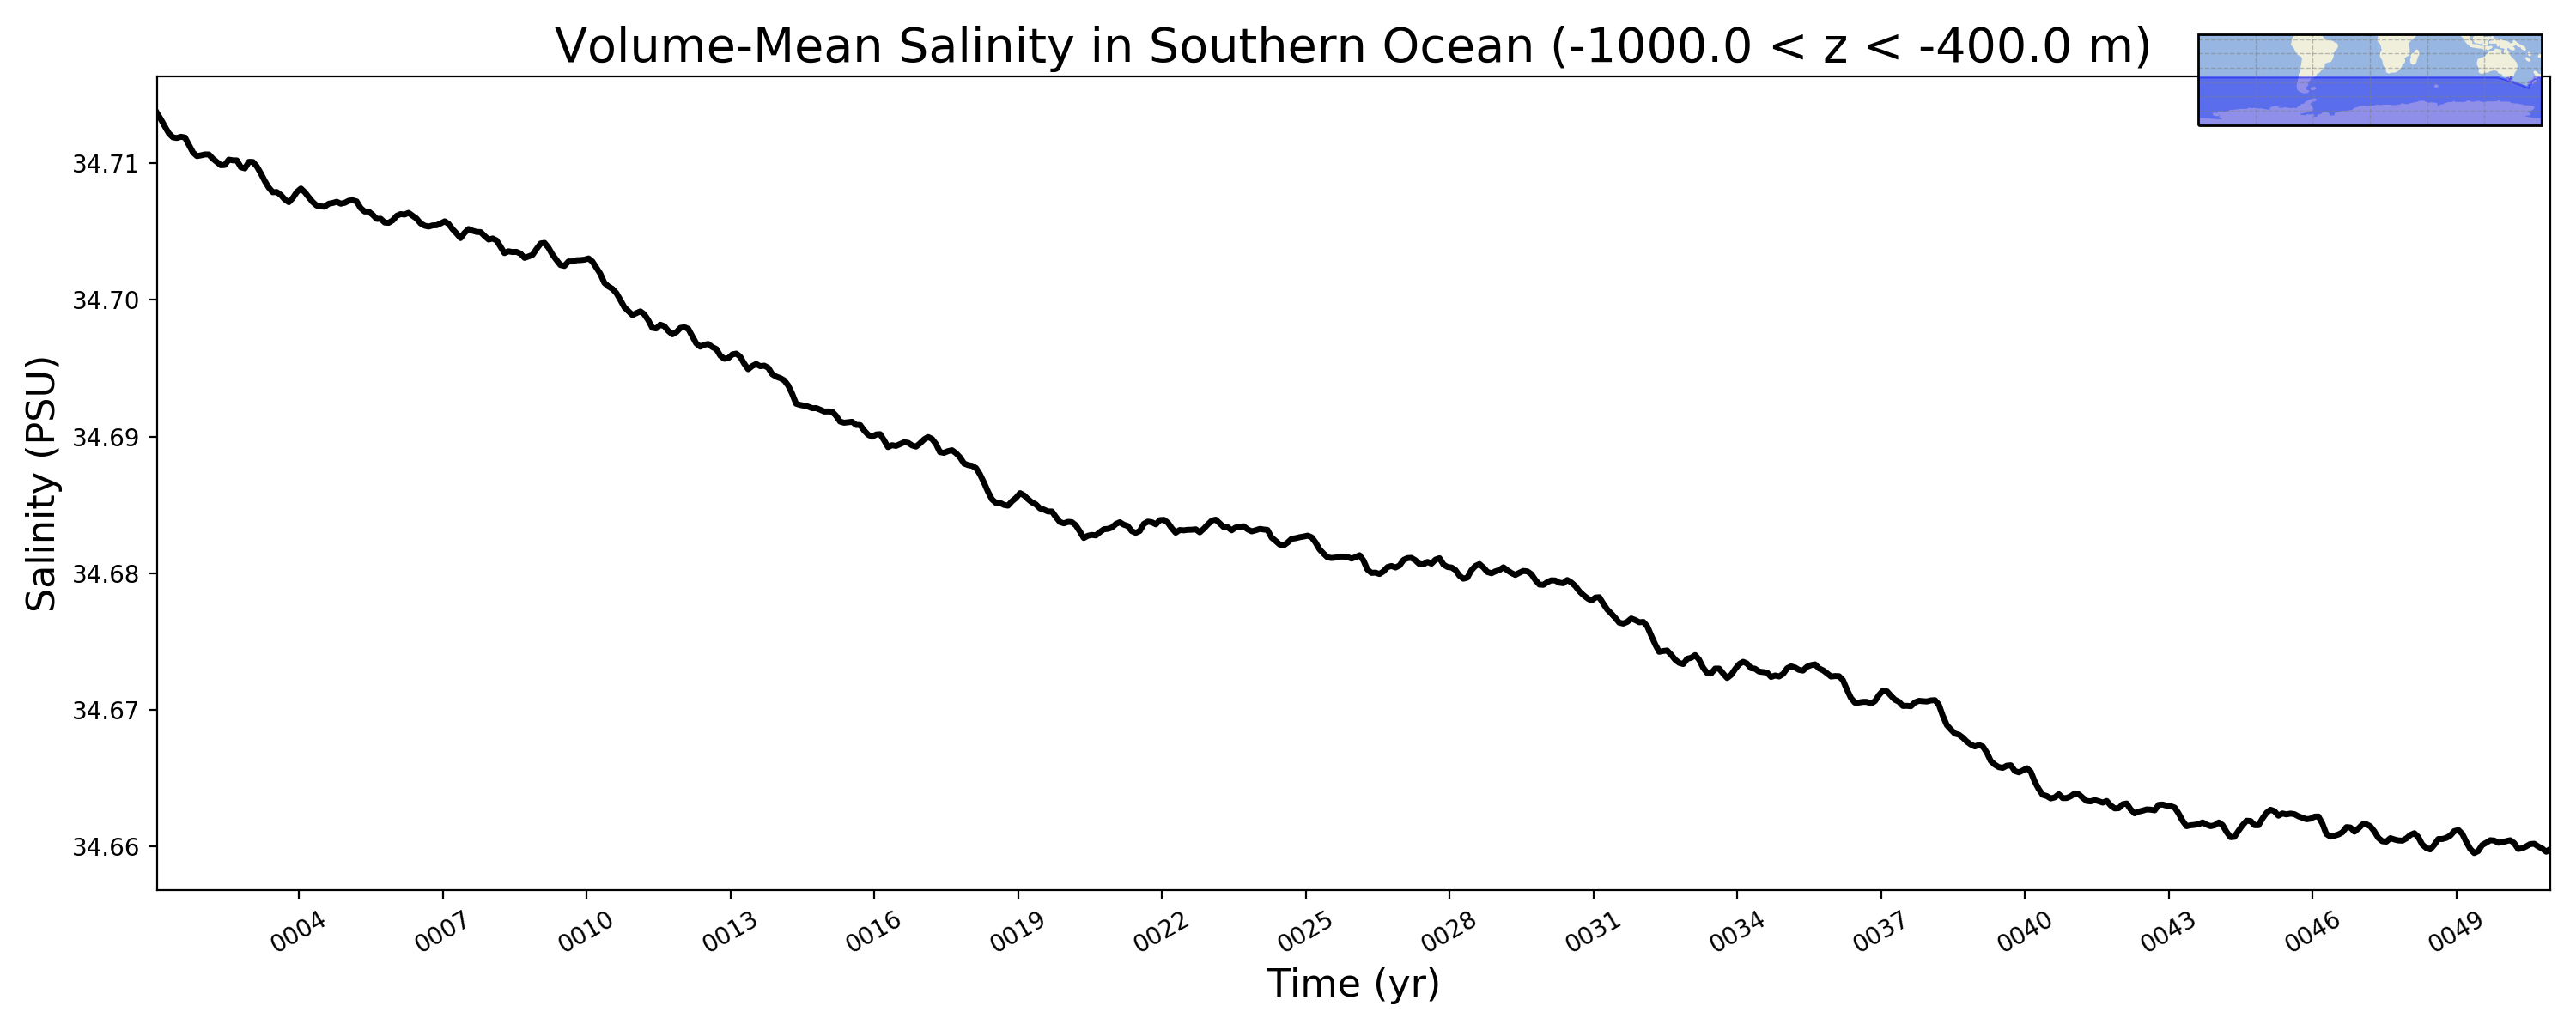
Southern Ocean
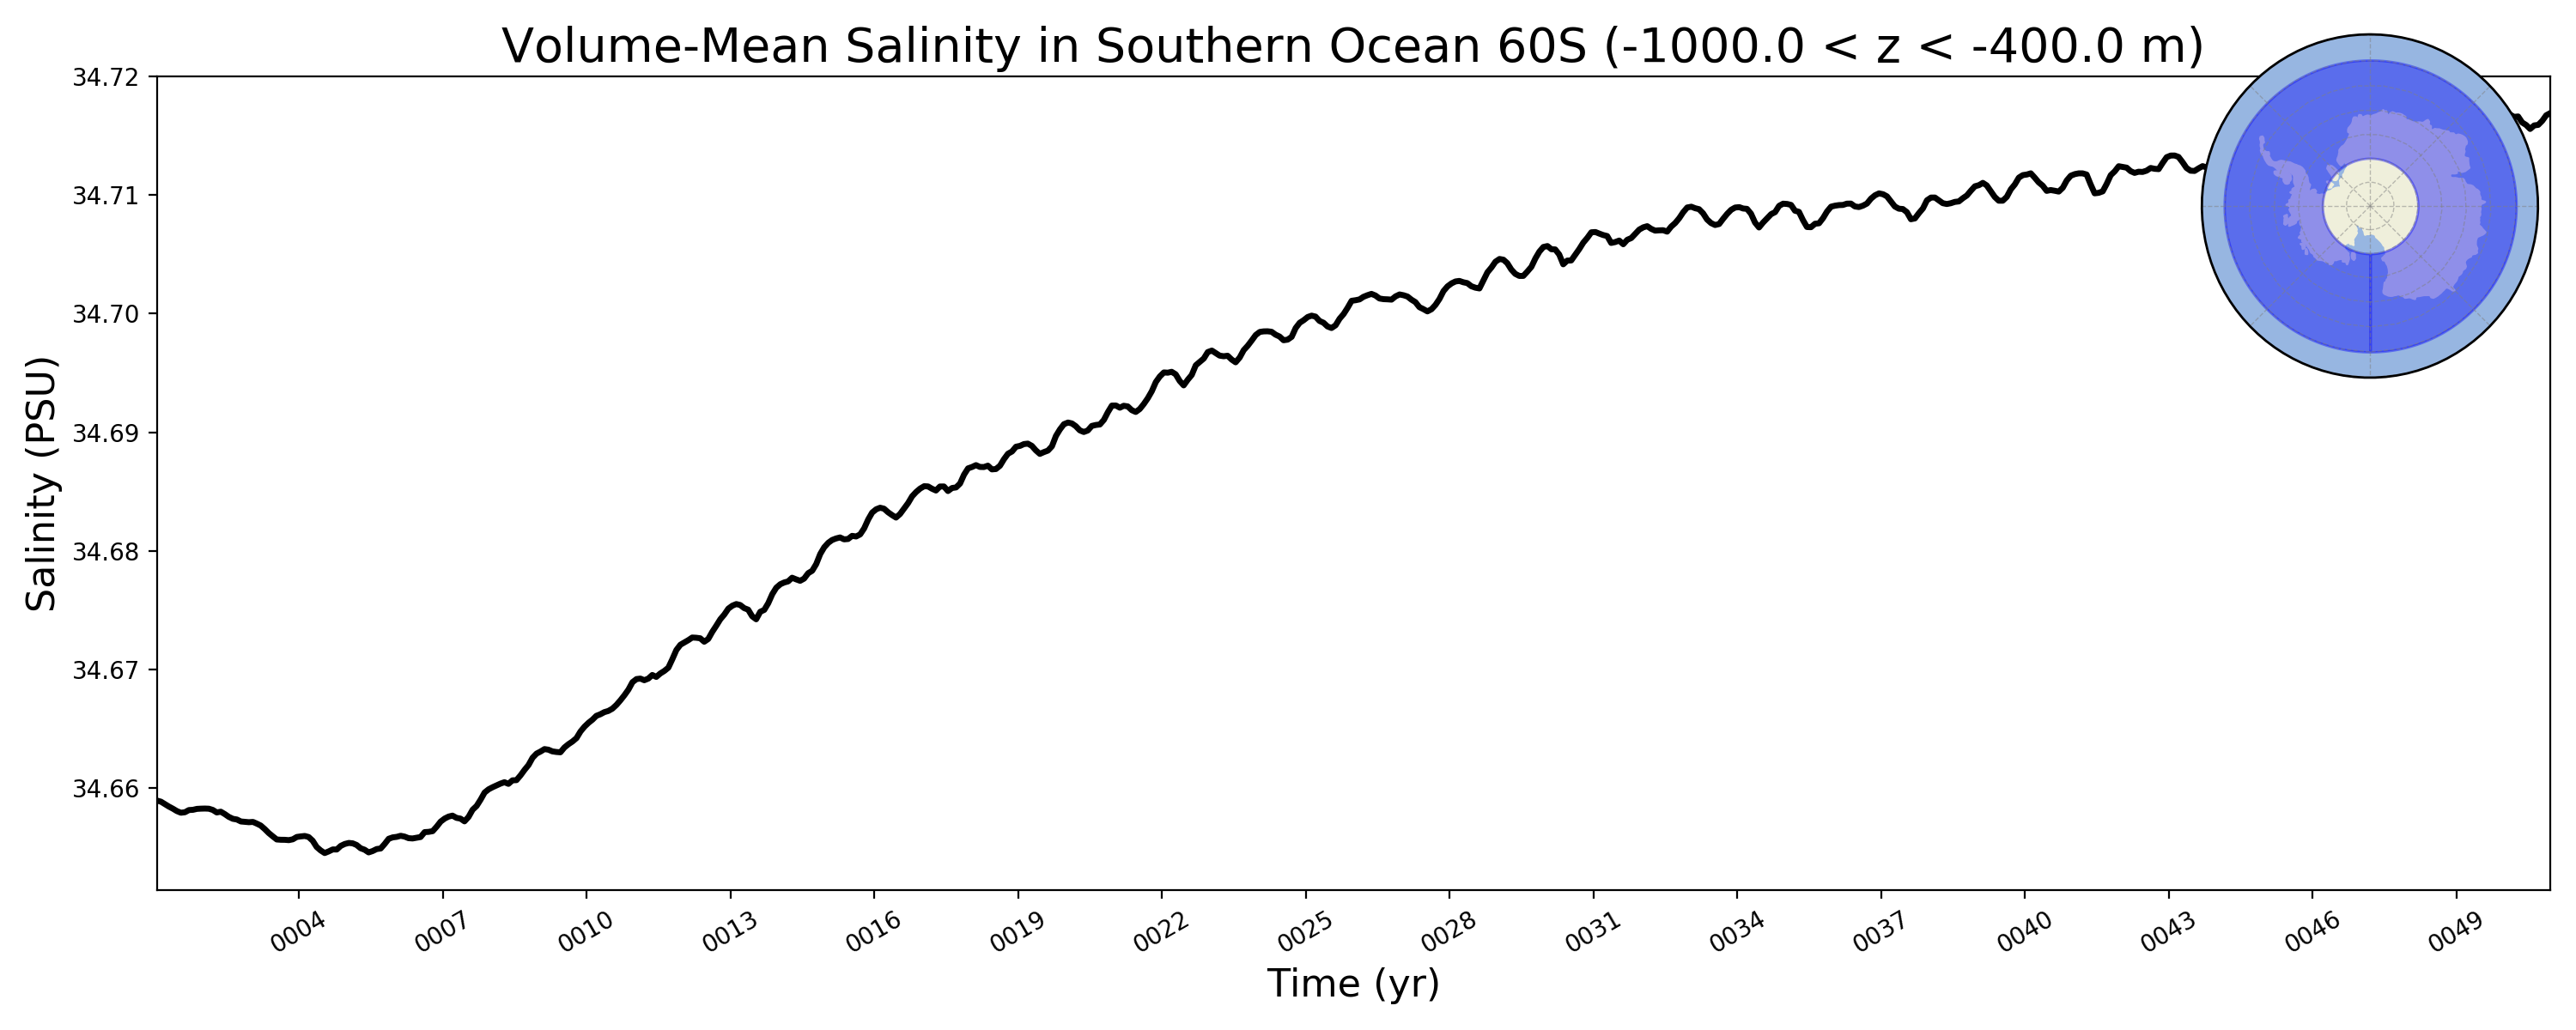
Southern Ocean 60S
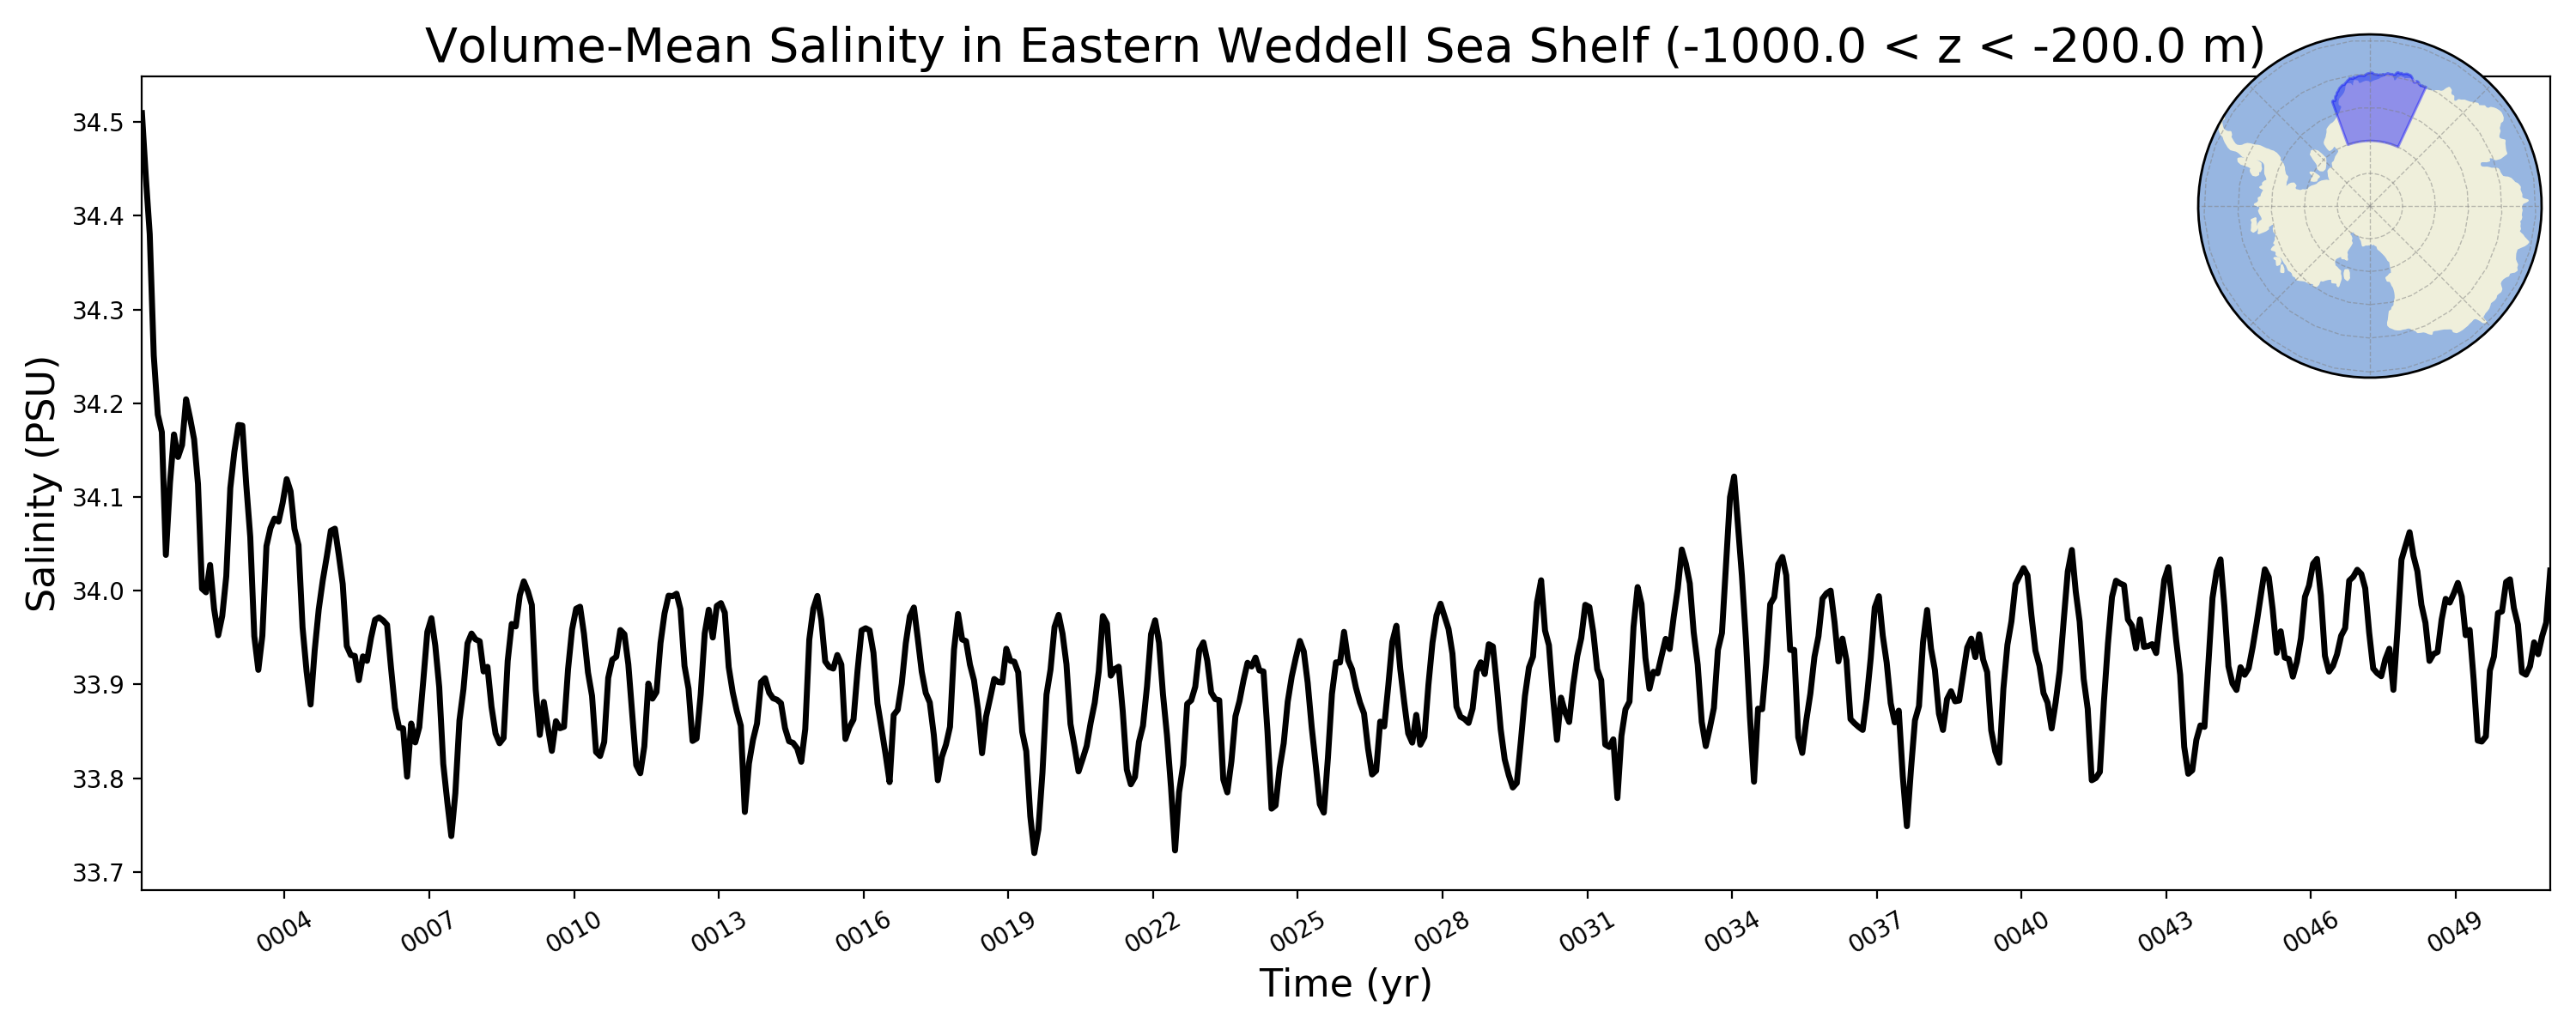
Eastern Weddell Sea Shelf
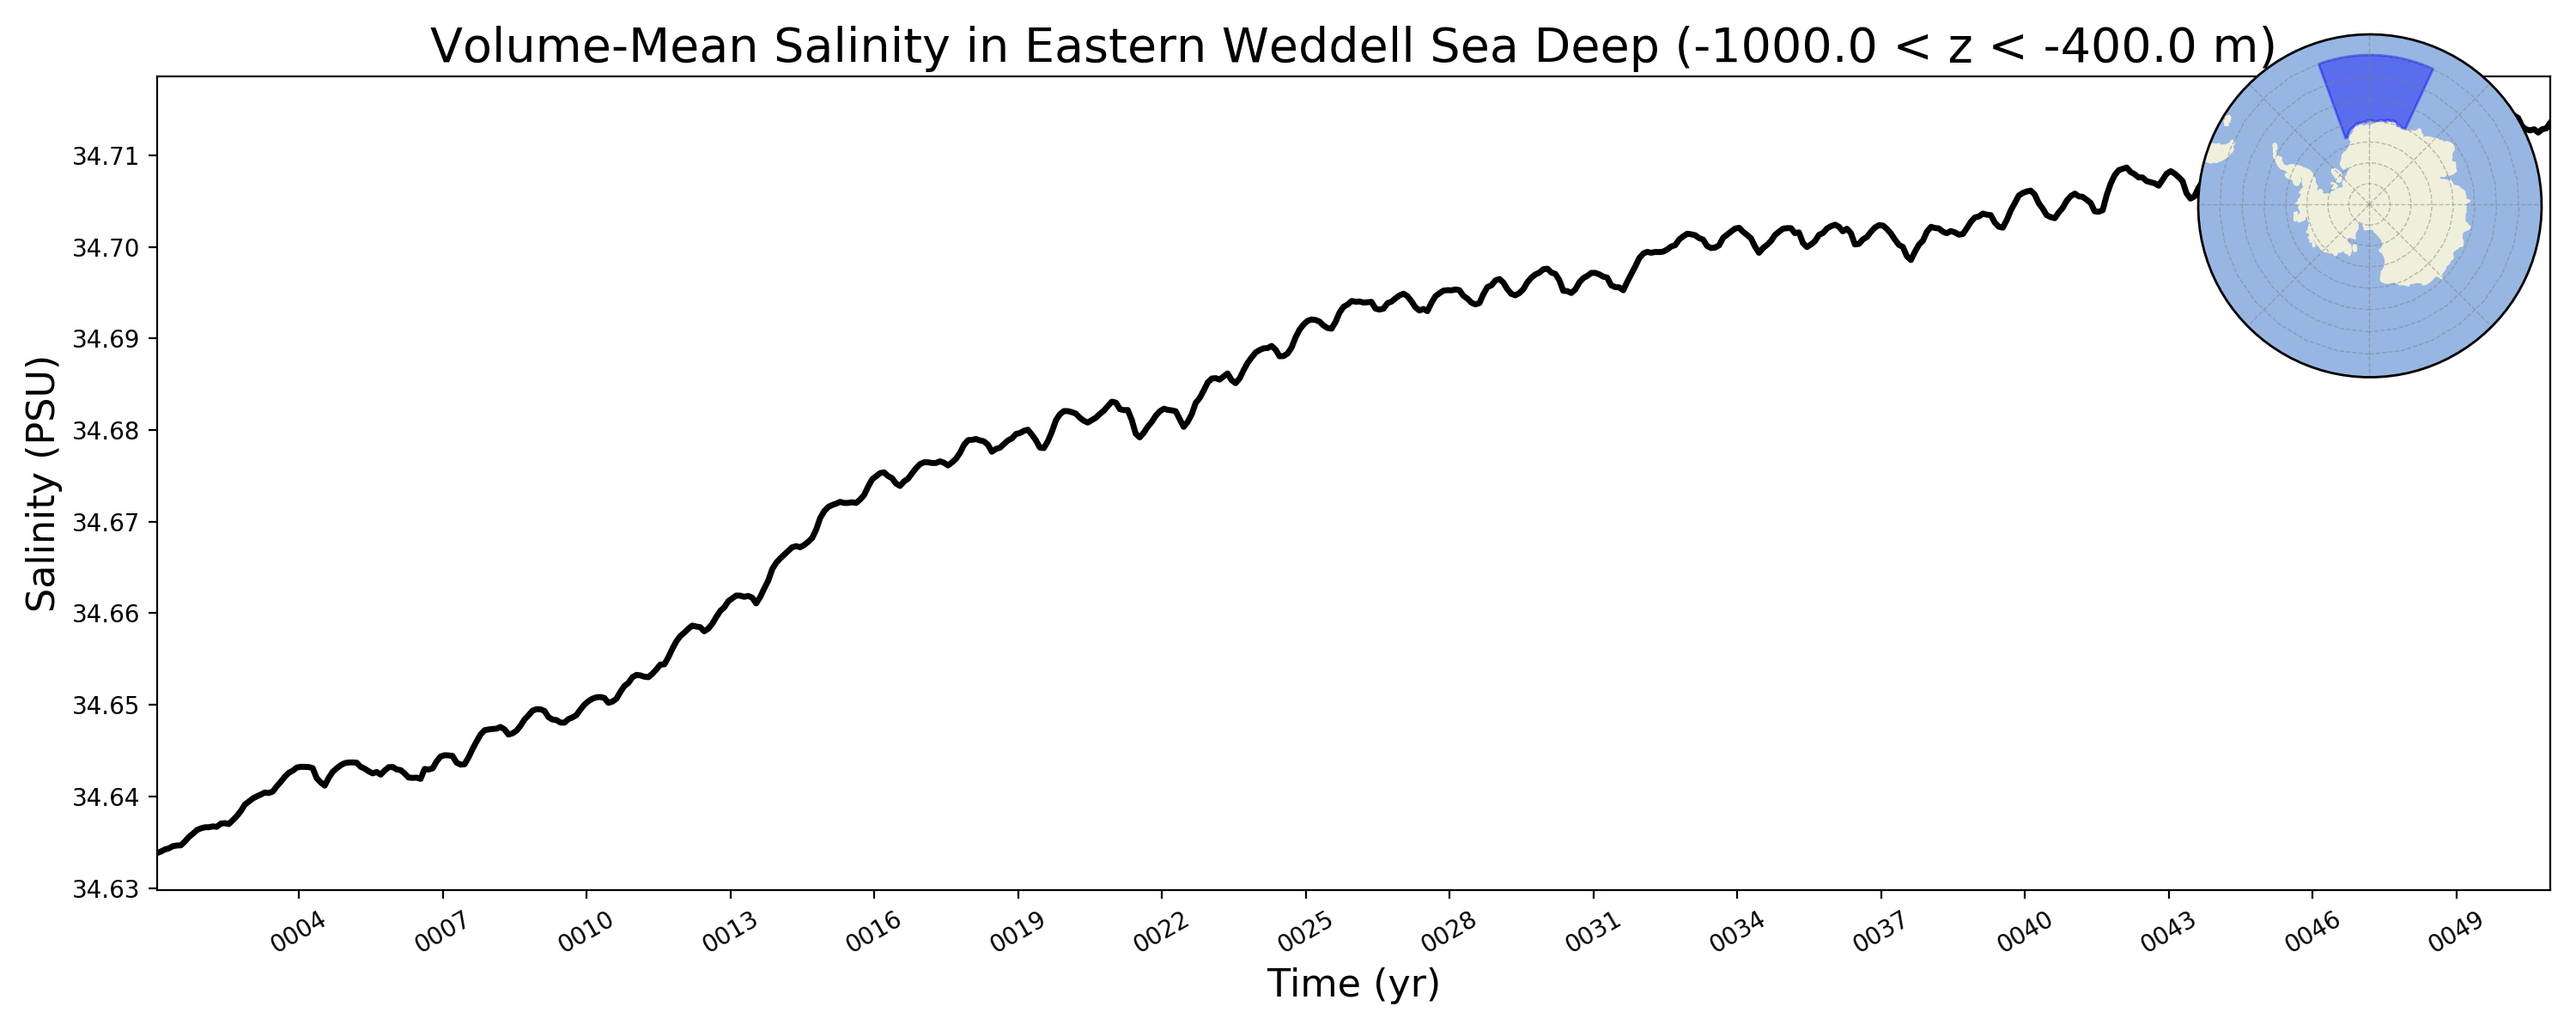
Eastern Weddell Sea Deep
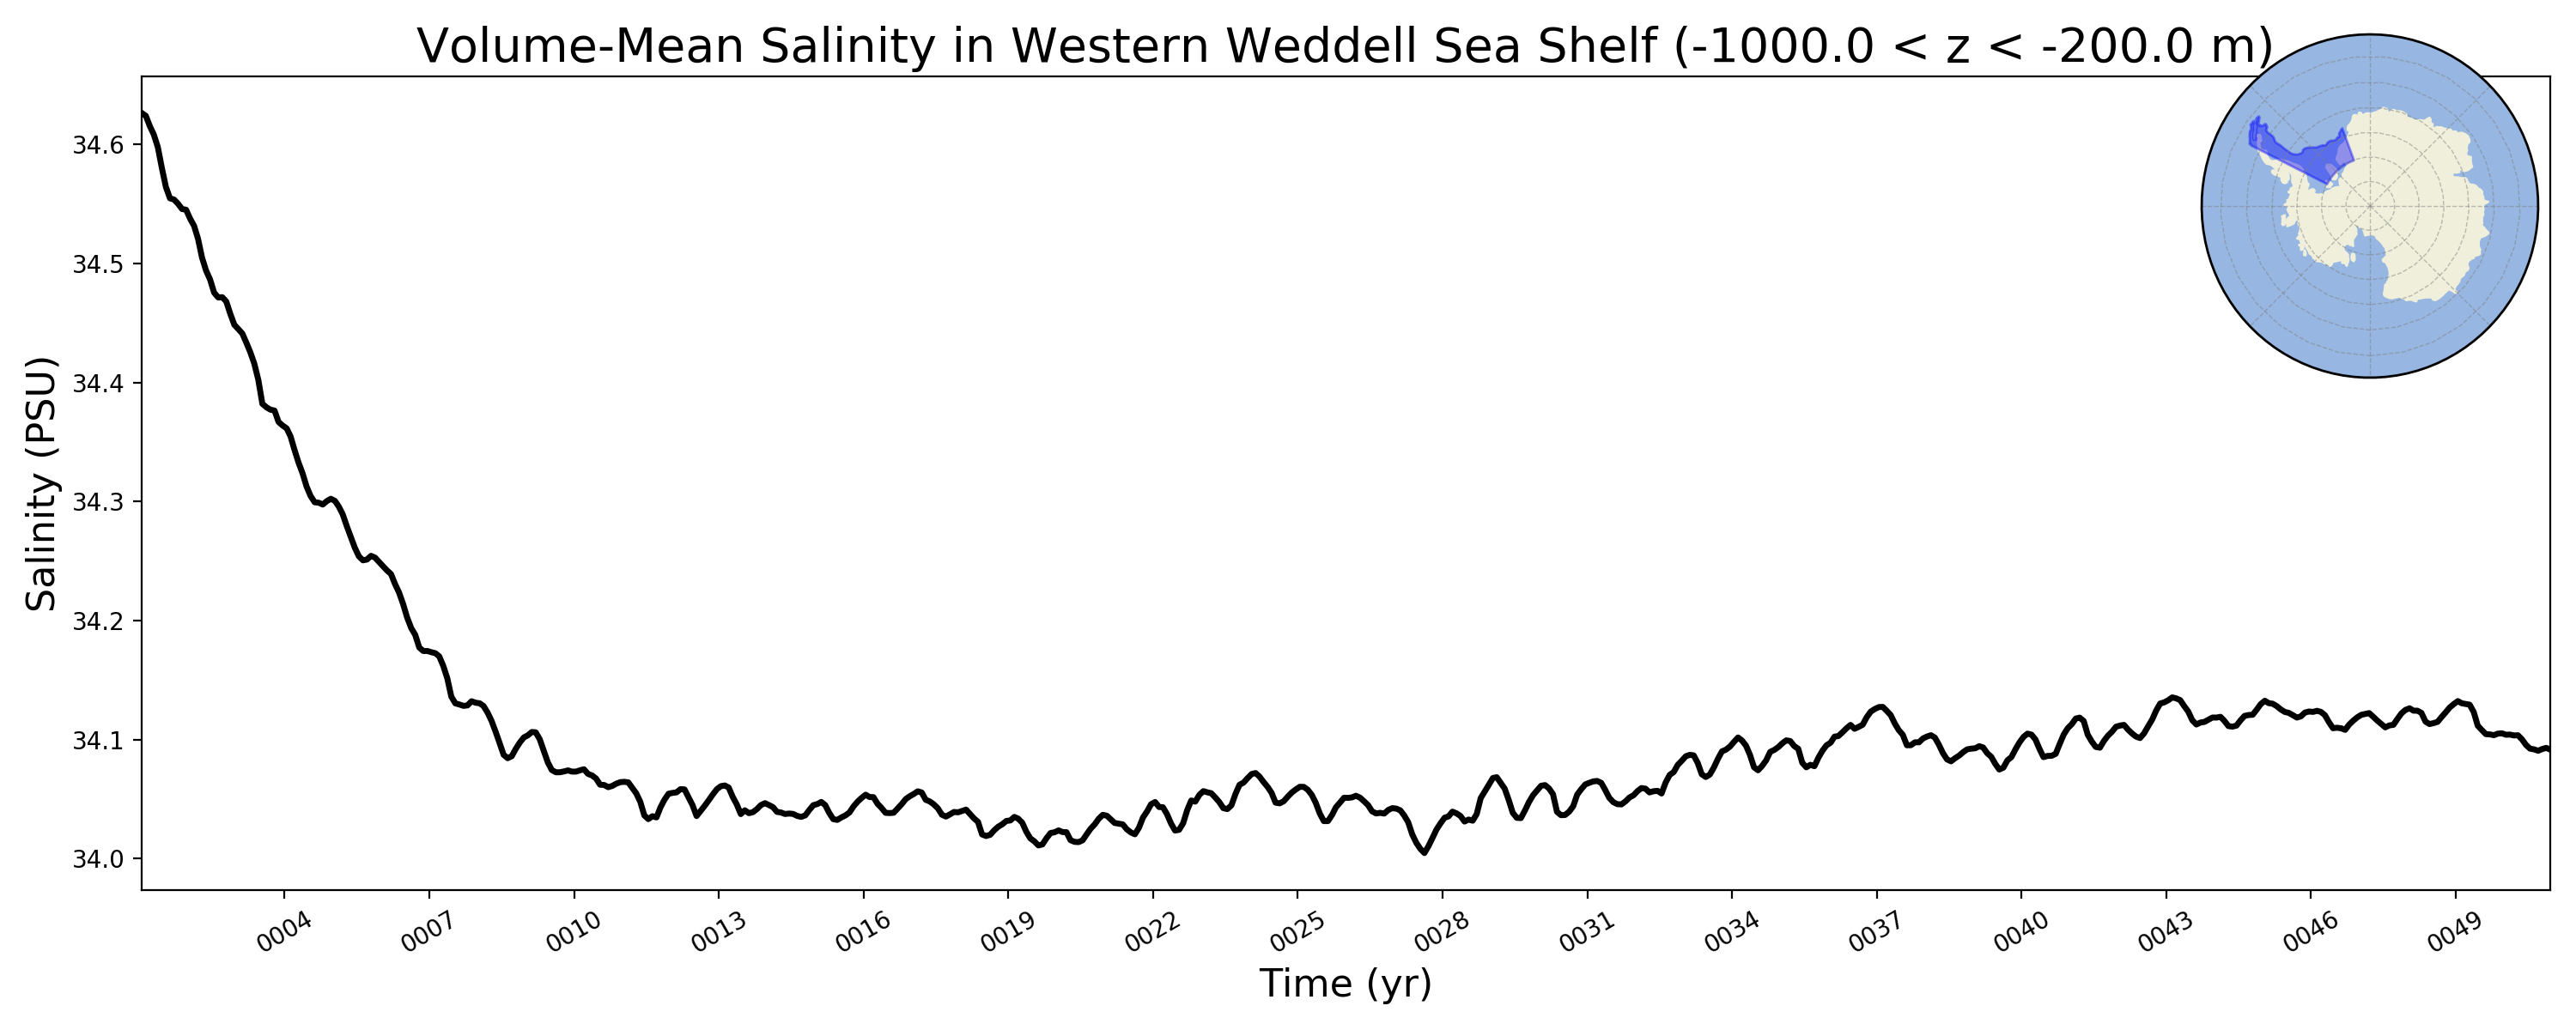
Western Weddell Sea Shelf
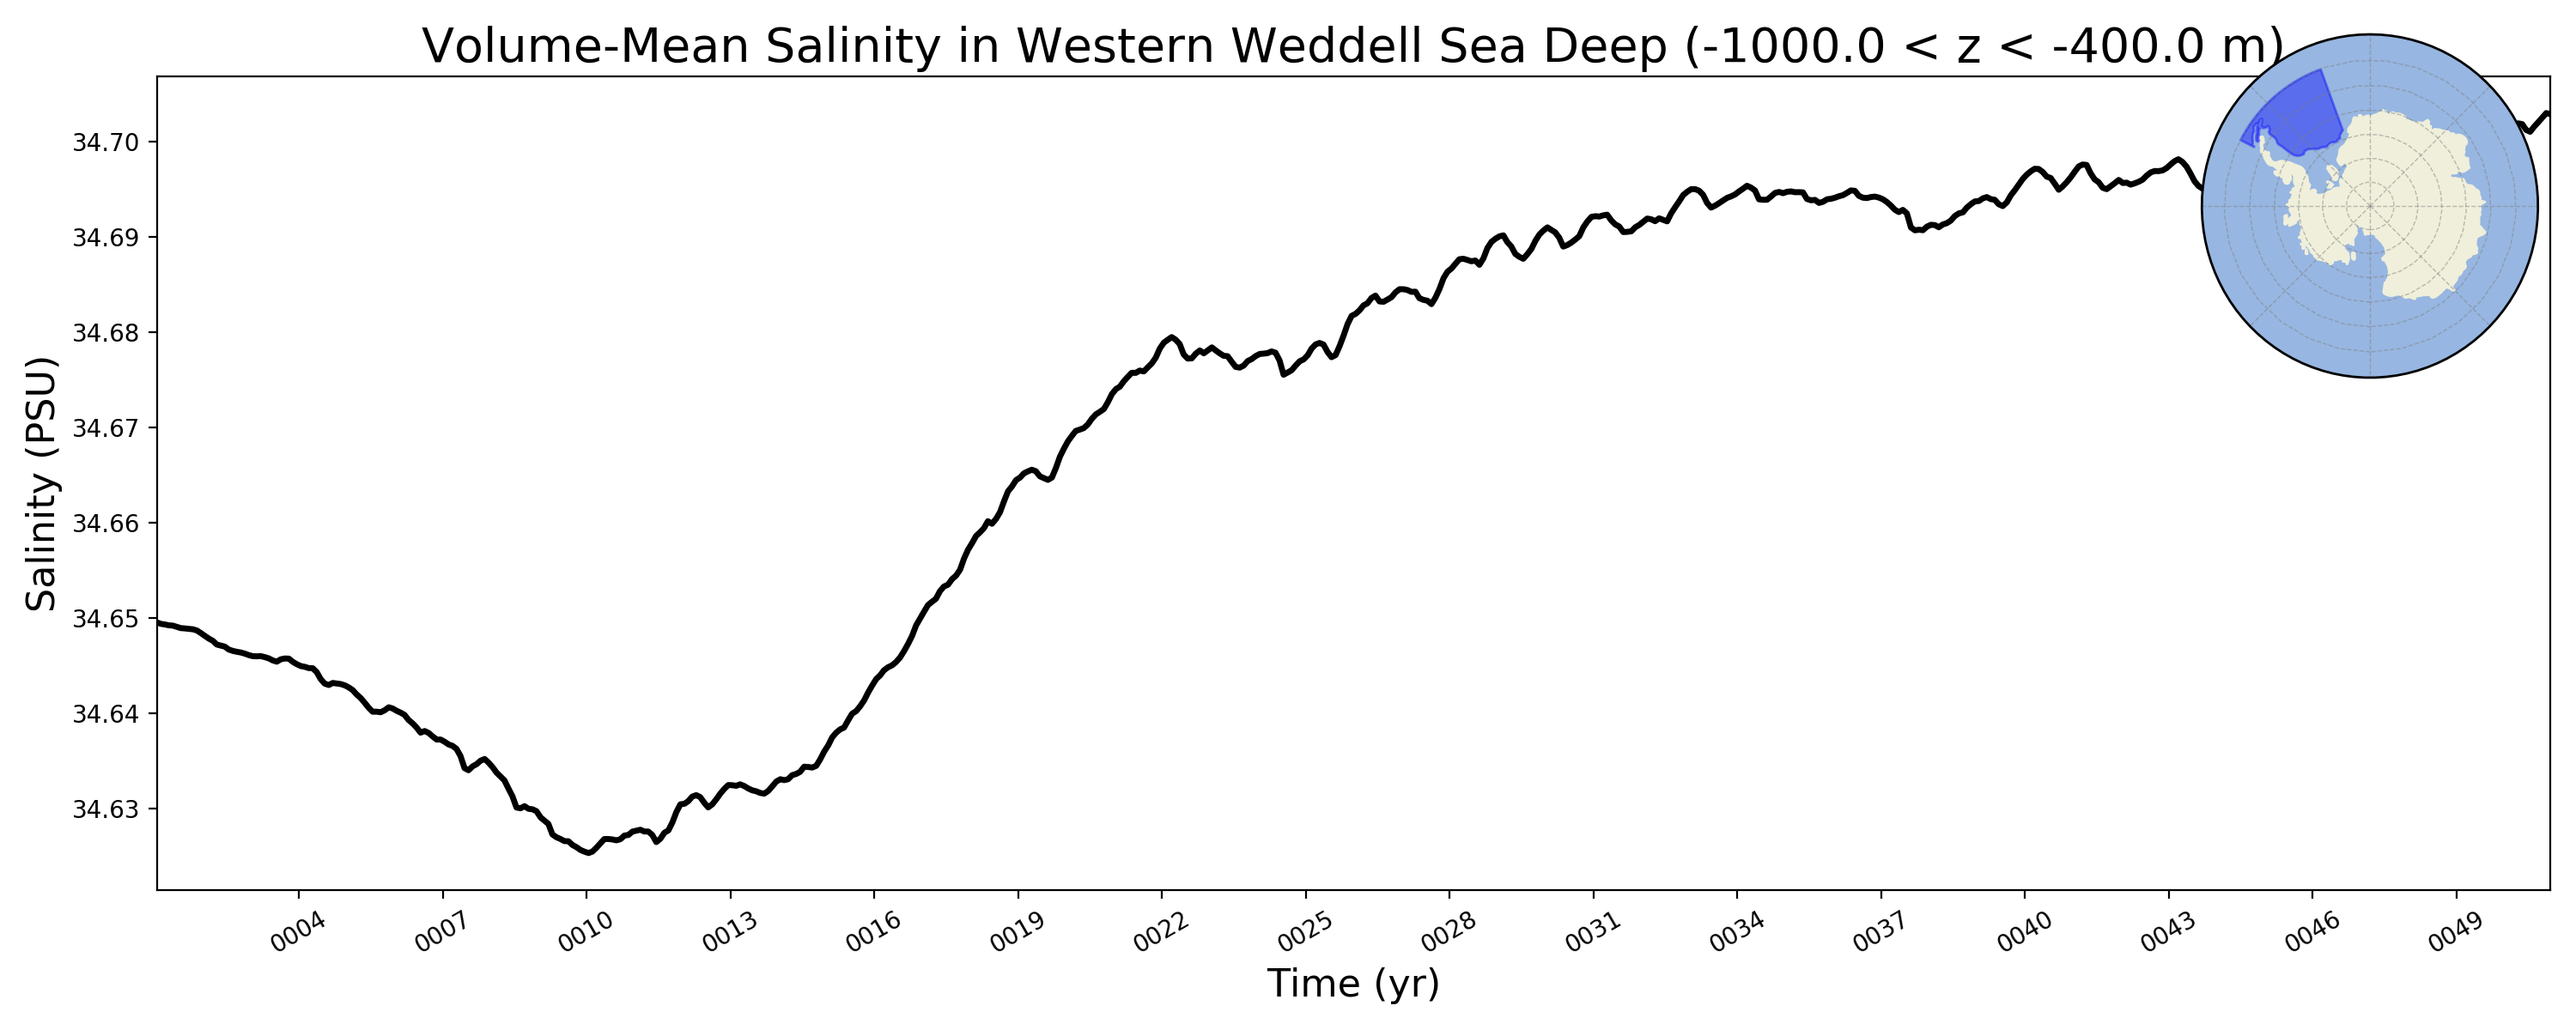
Western Weddell Sea Deep
Weddell Sea Shelf
Weddell Sea Deep
Bellingshausen Sea Shelf
Bellingshausen Sea Deep
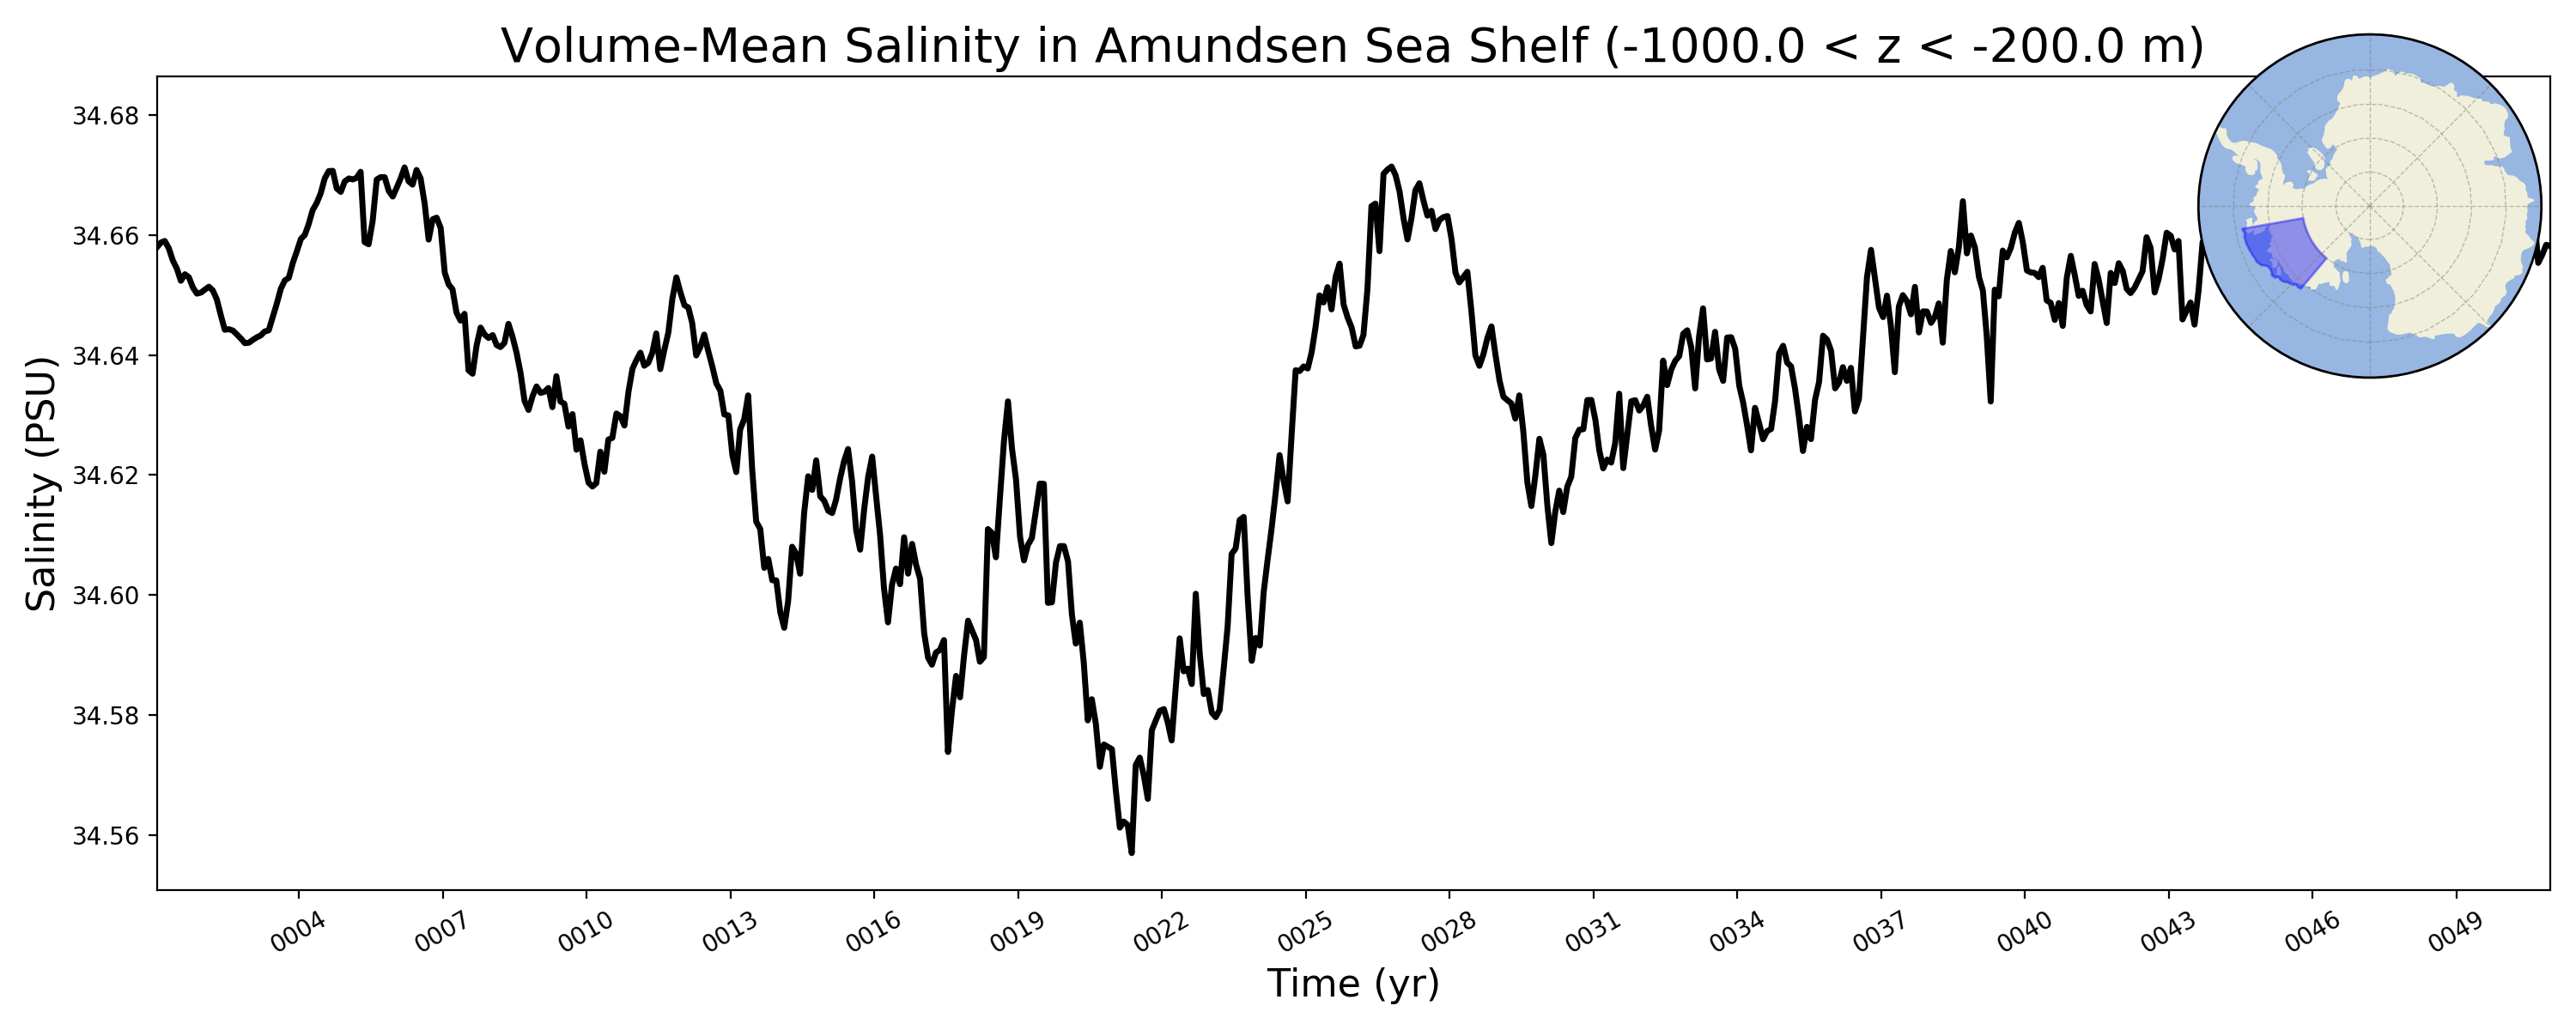
Amundsen Sea Shelf
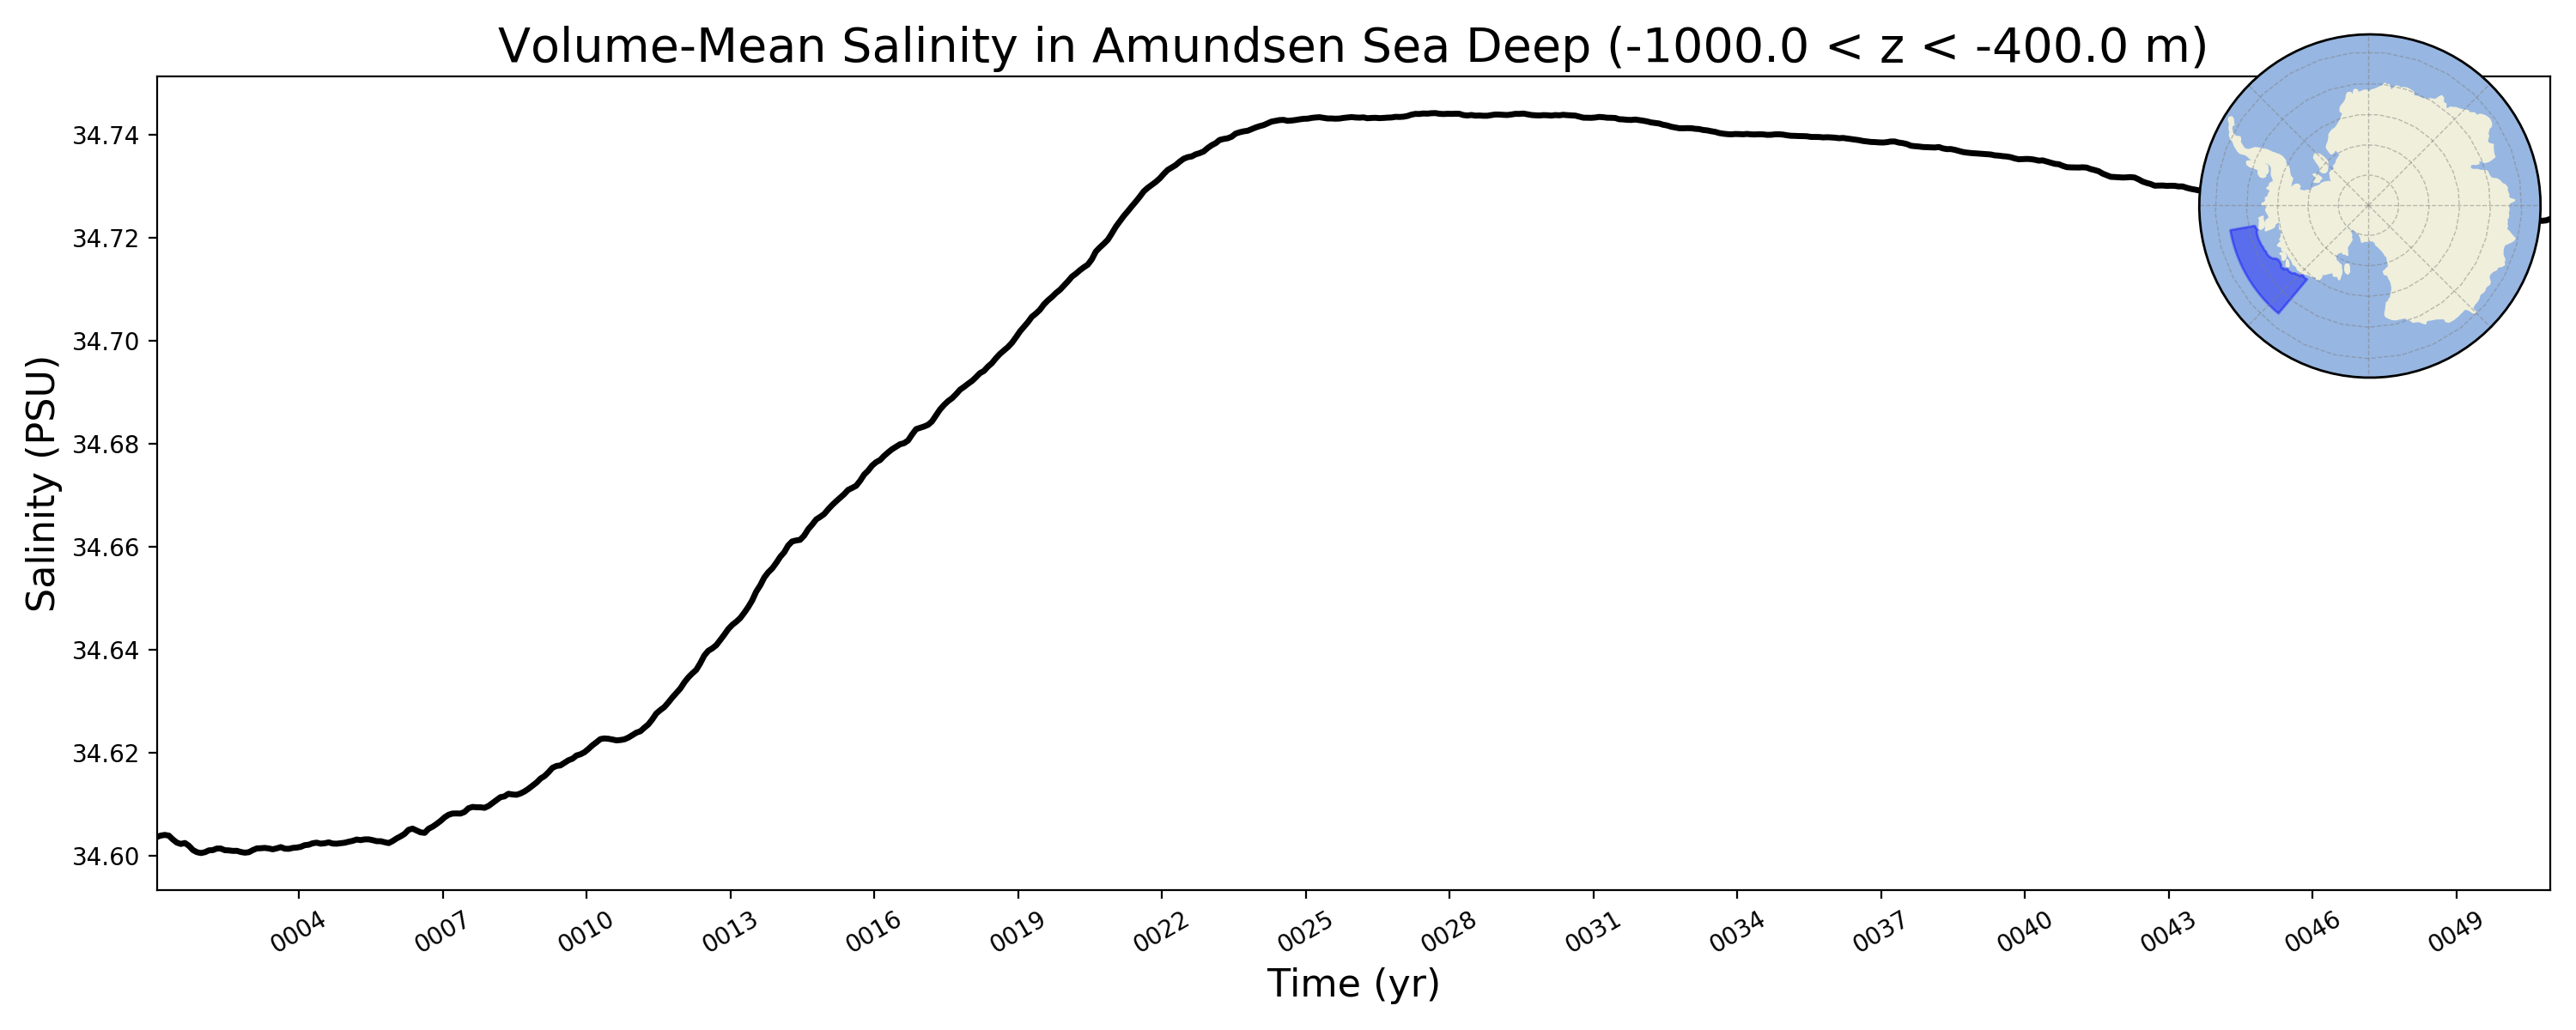
Amundsen Sea Deep
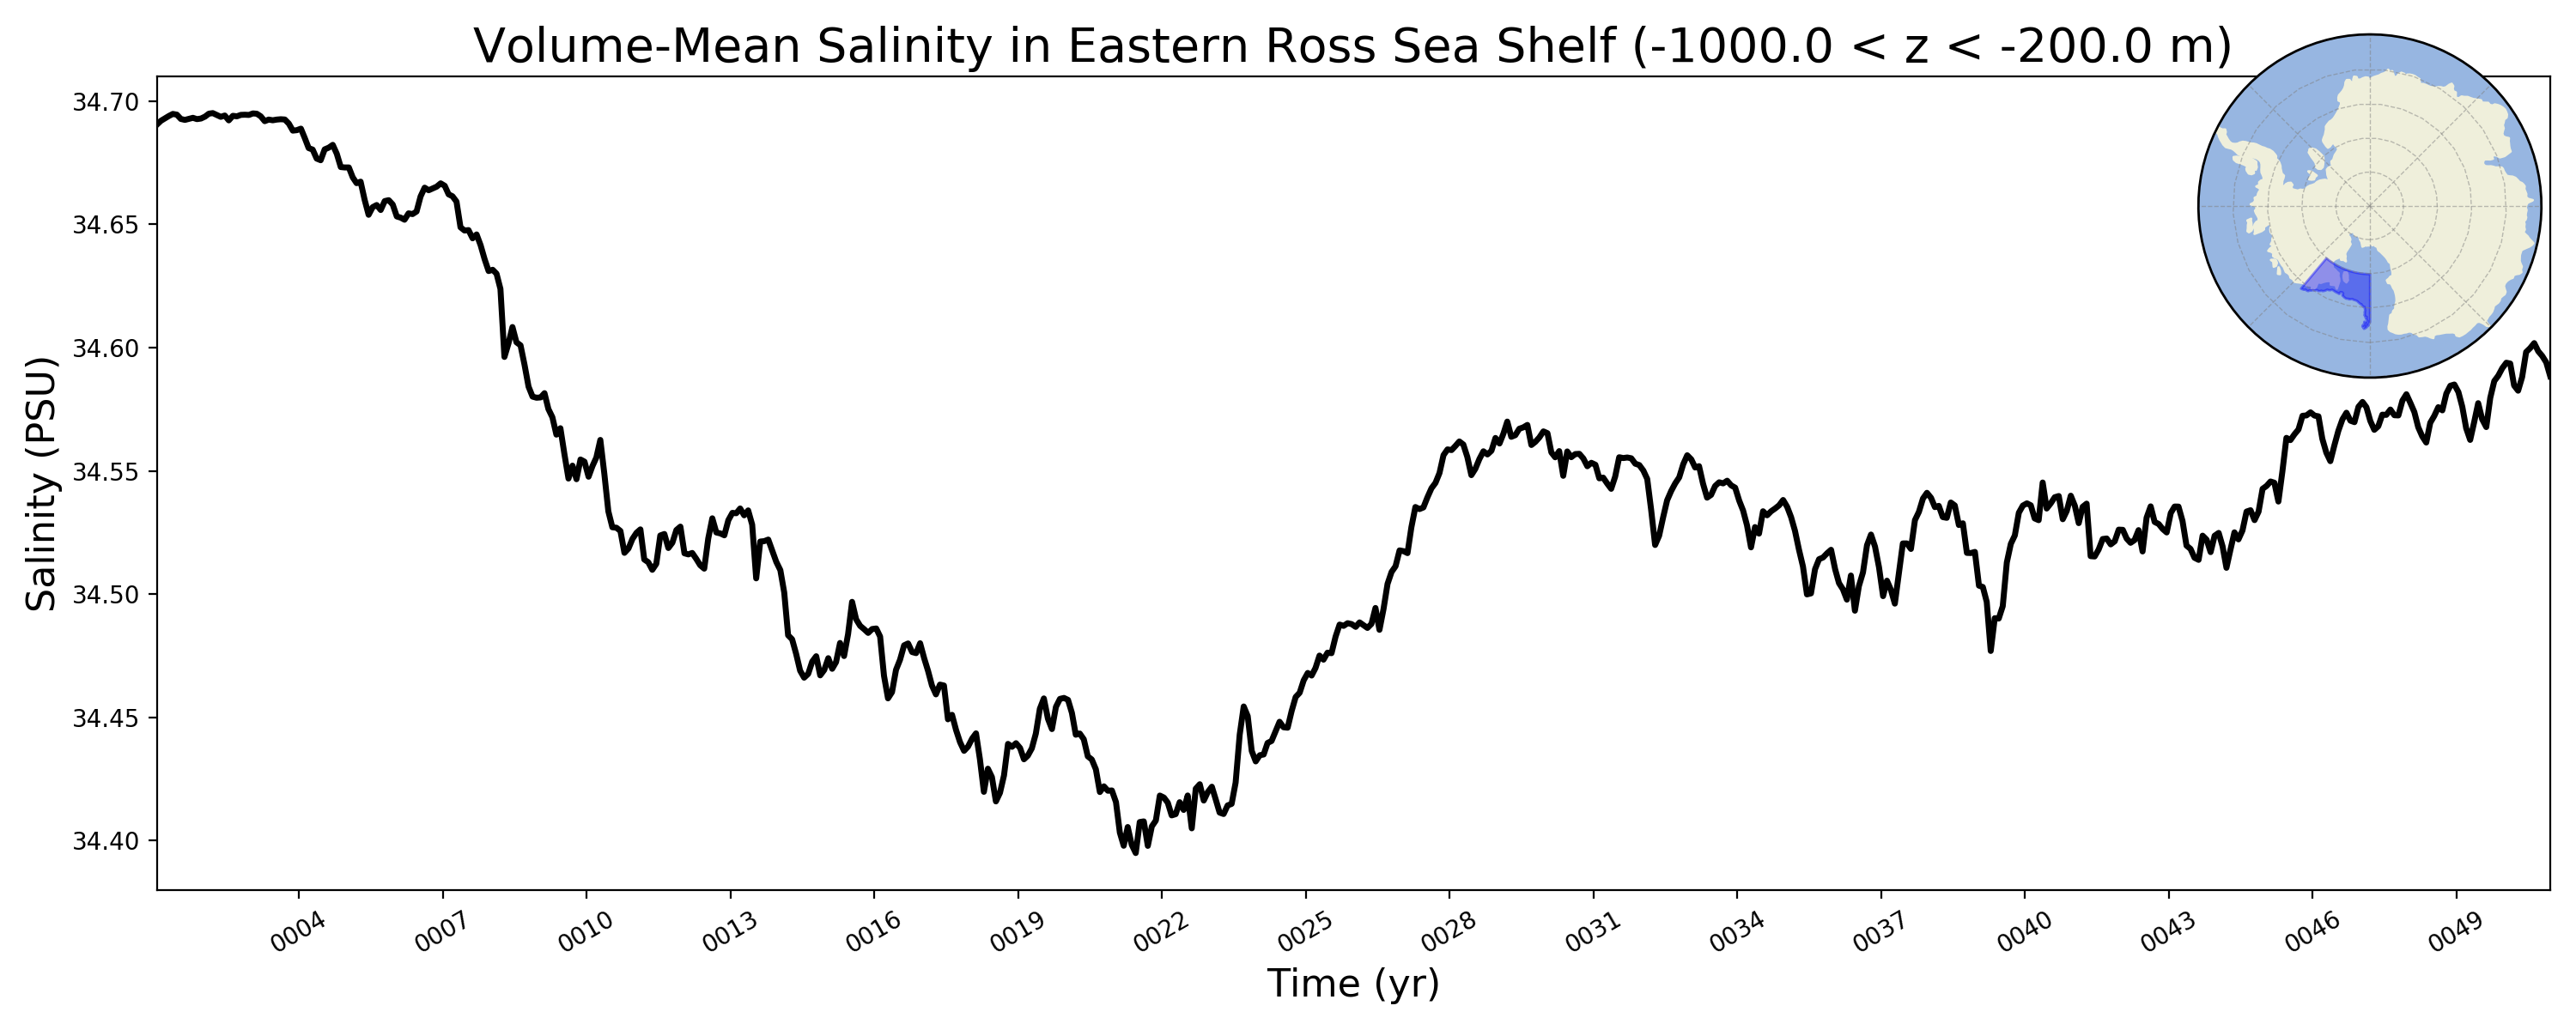
Eastern Ross Sea Shelf
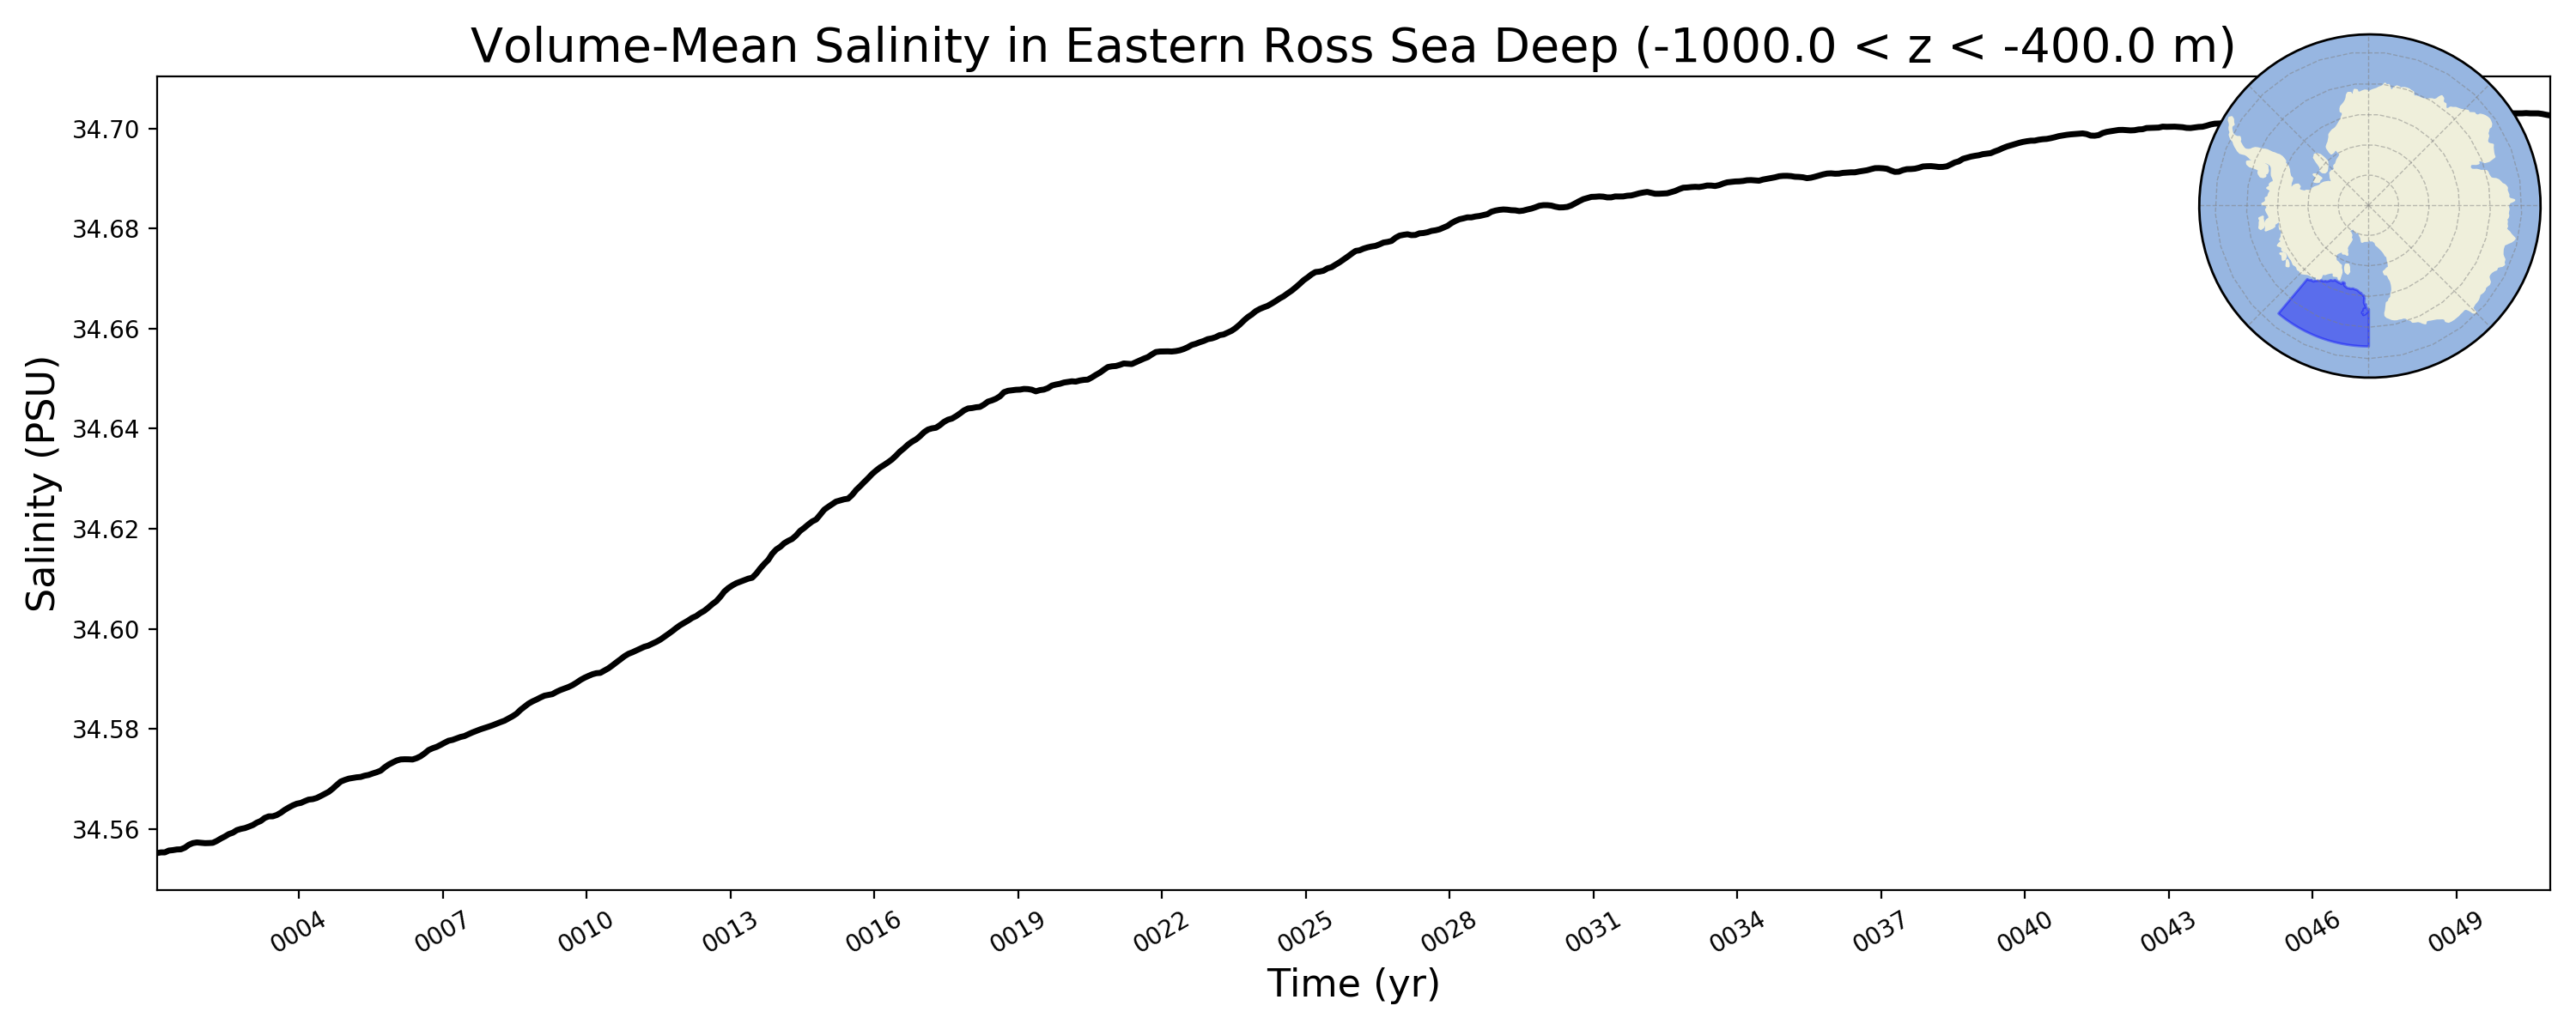
Eastern Ross Sea Deep
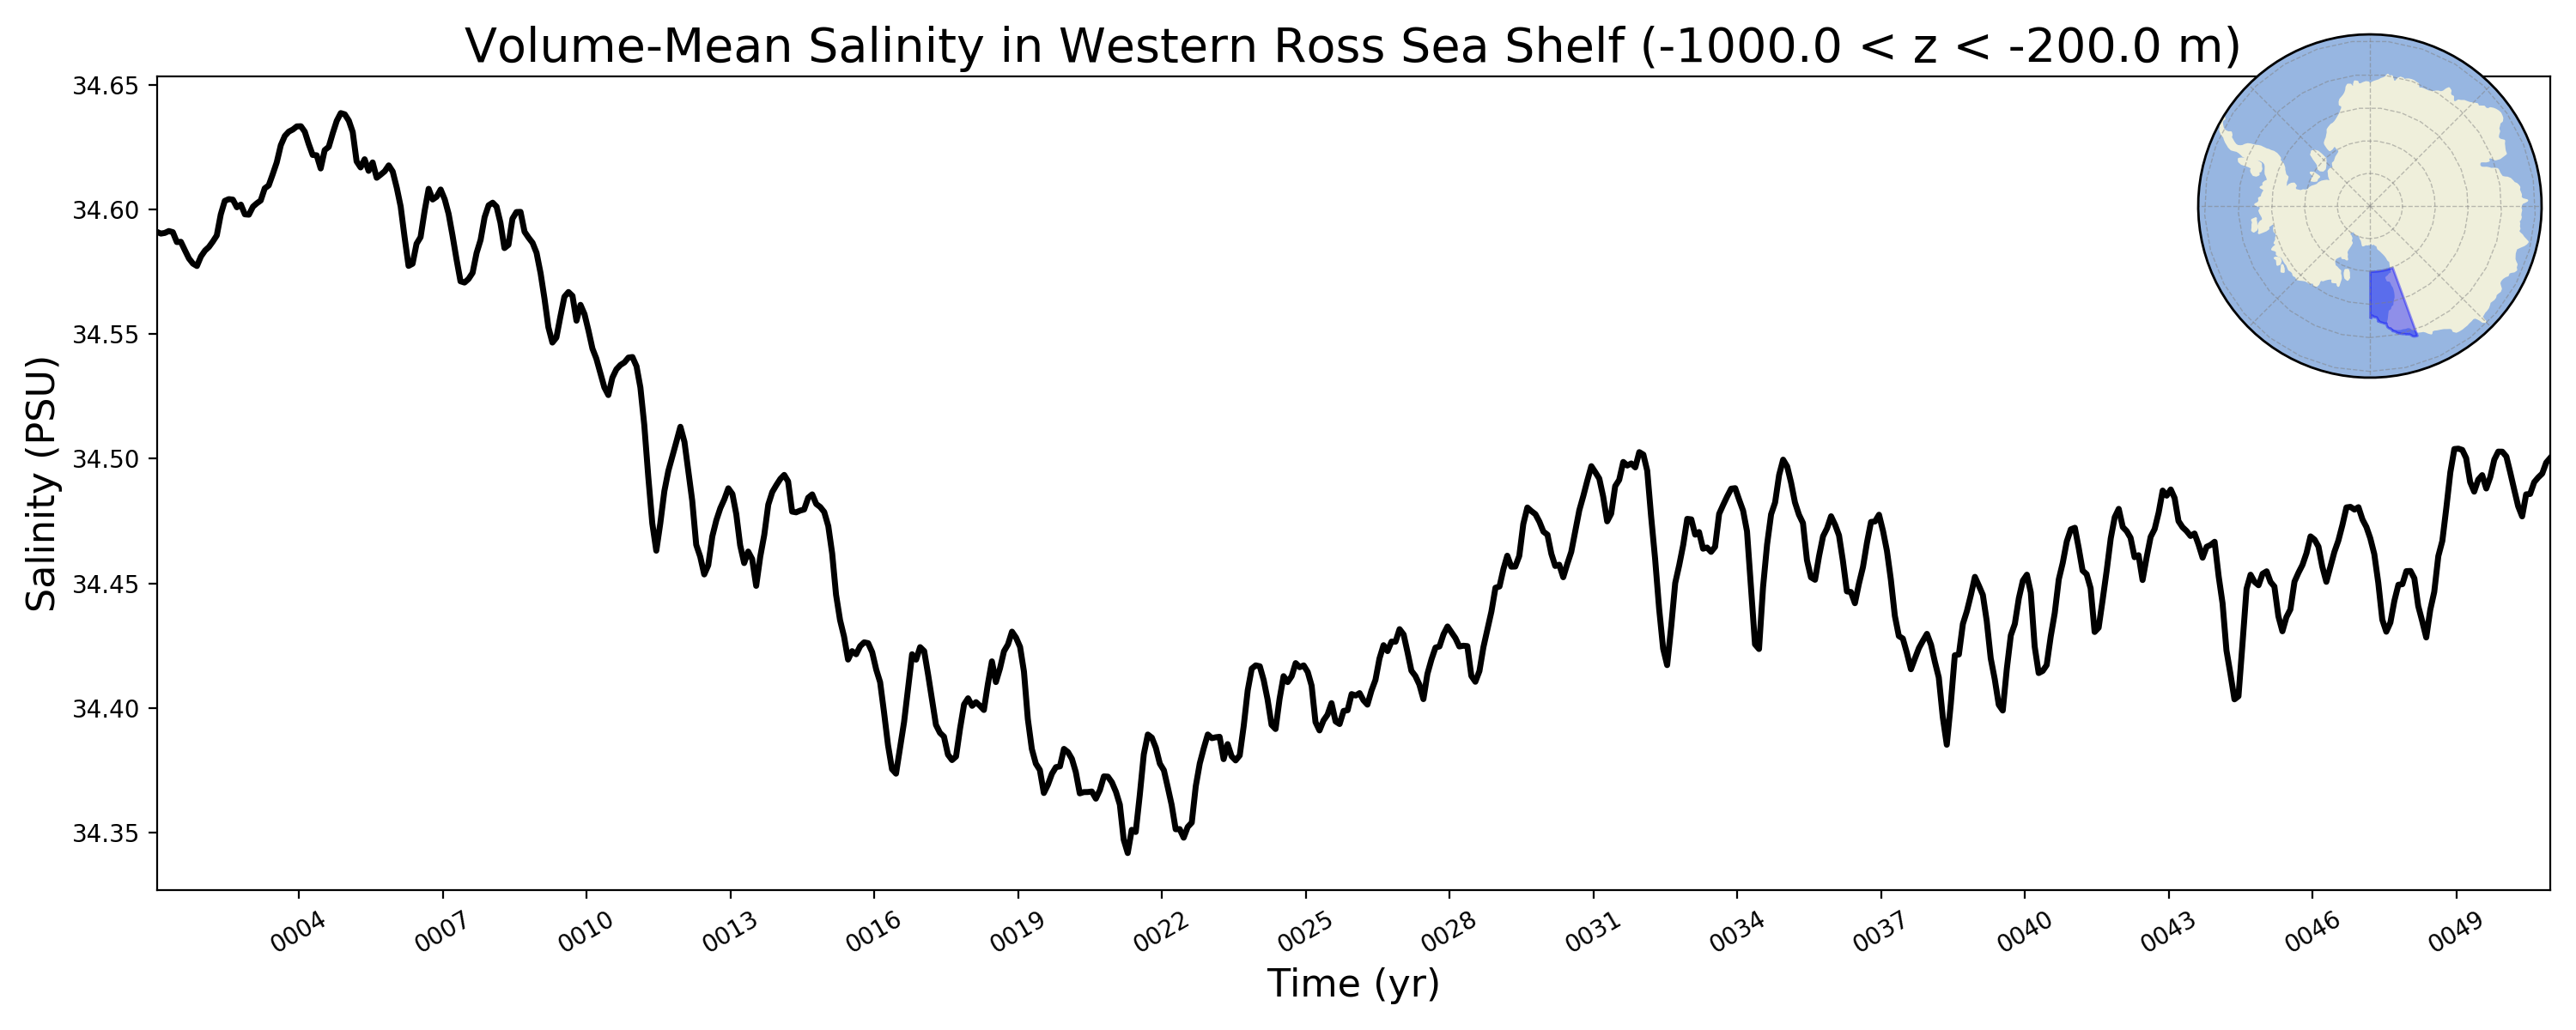
Western Ross Sea Shelf
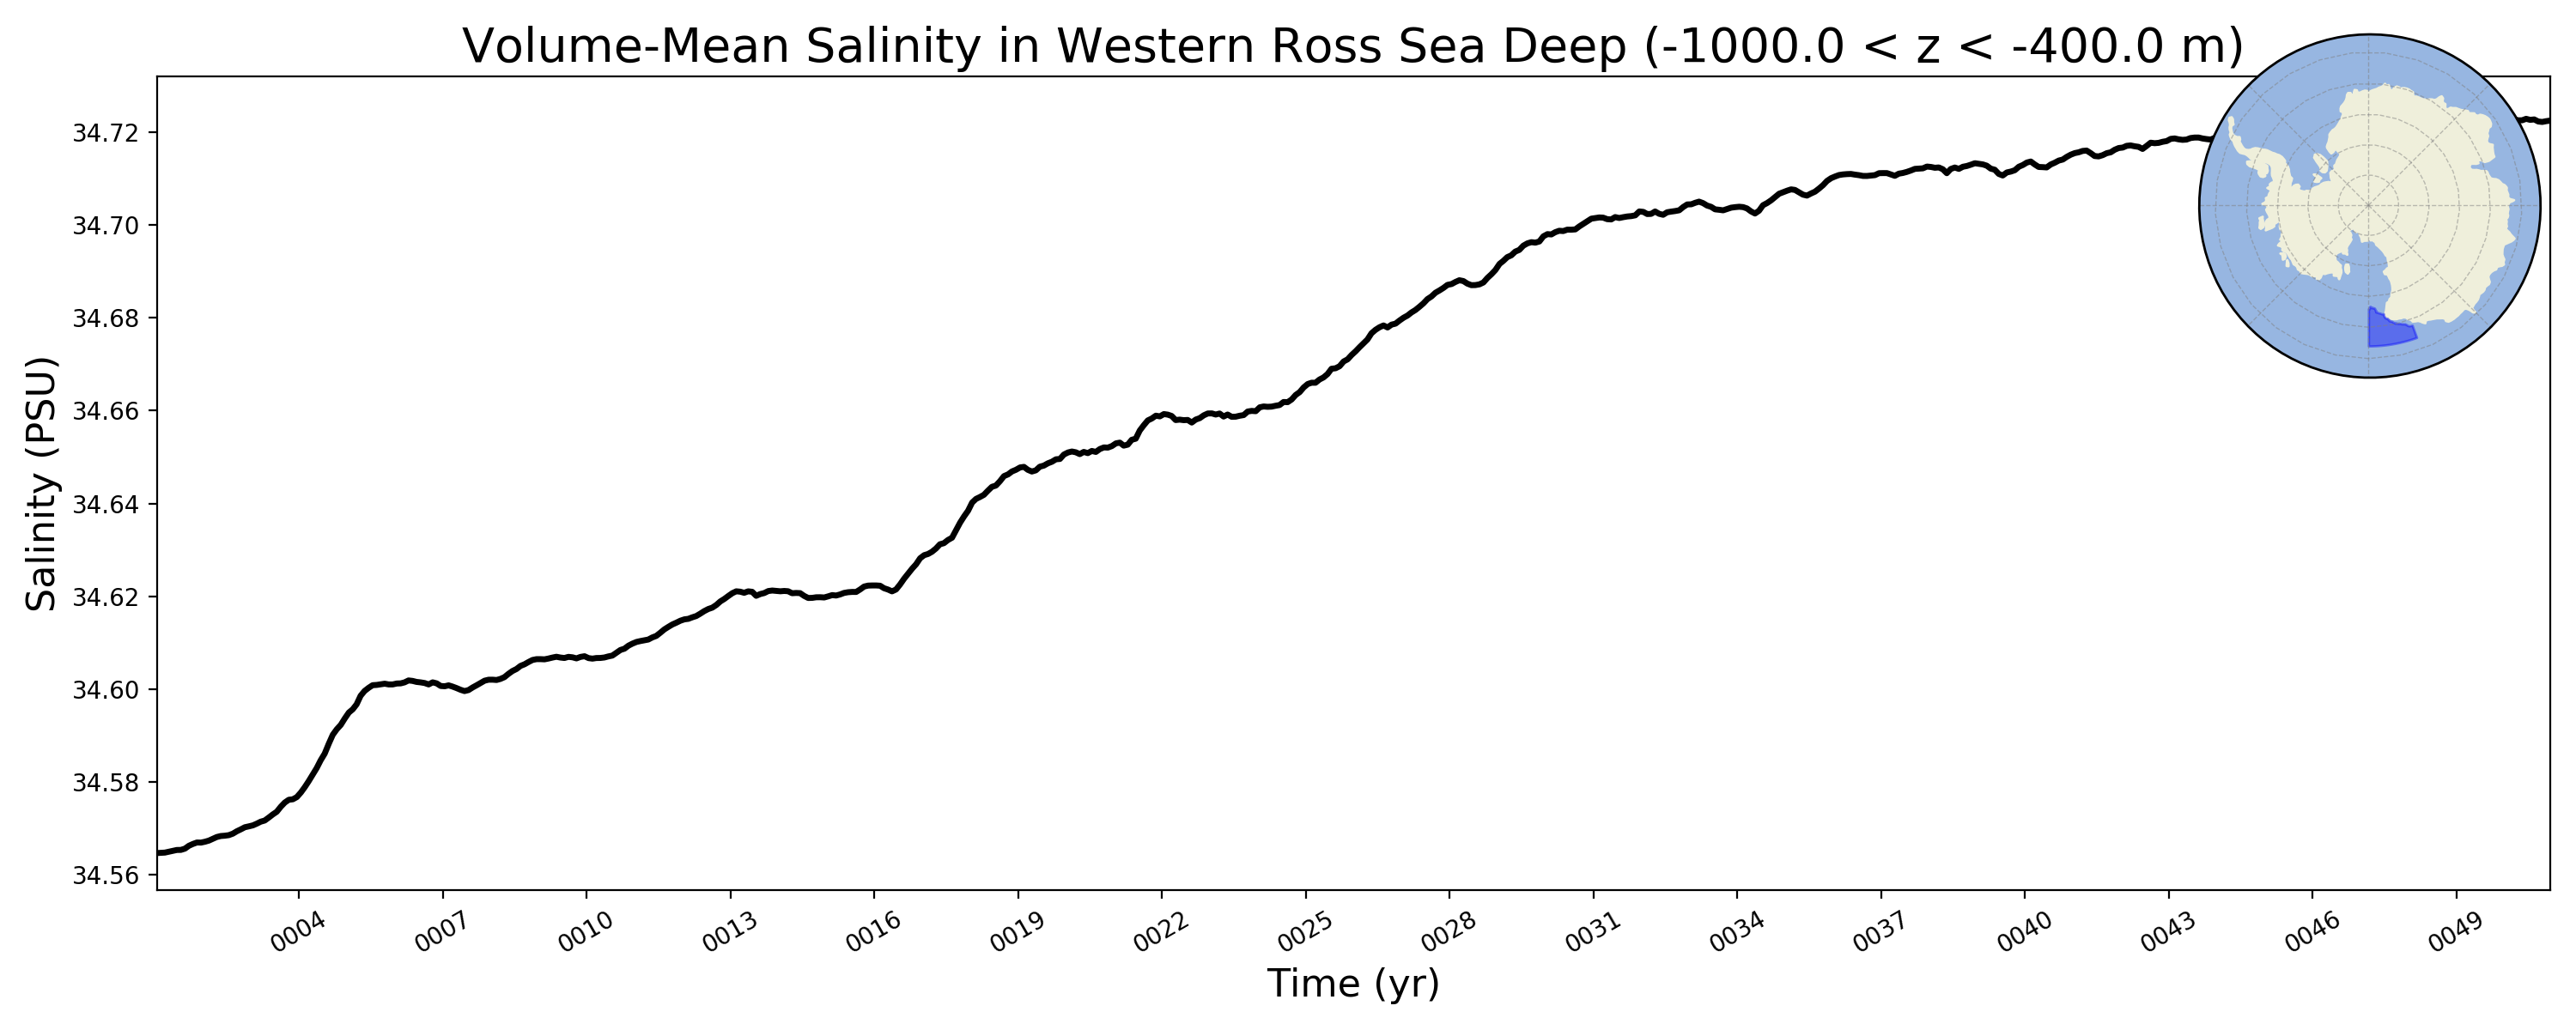
Western Ross Sea Deep
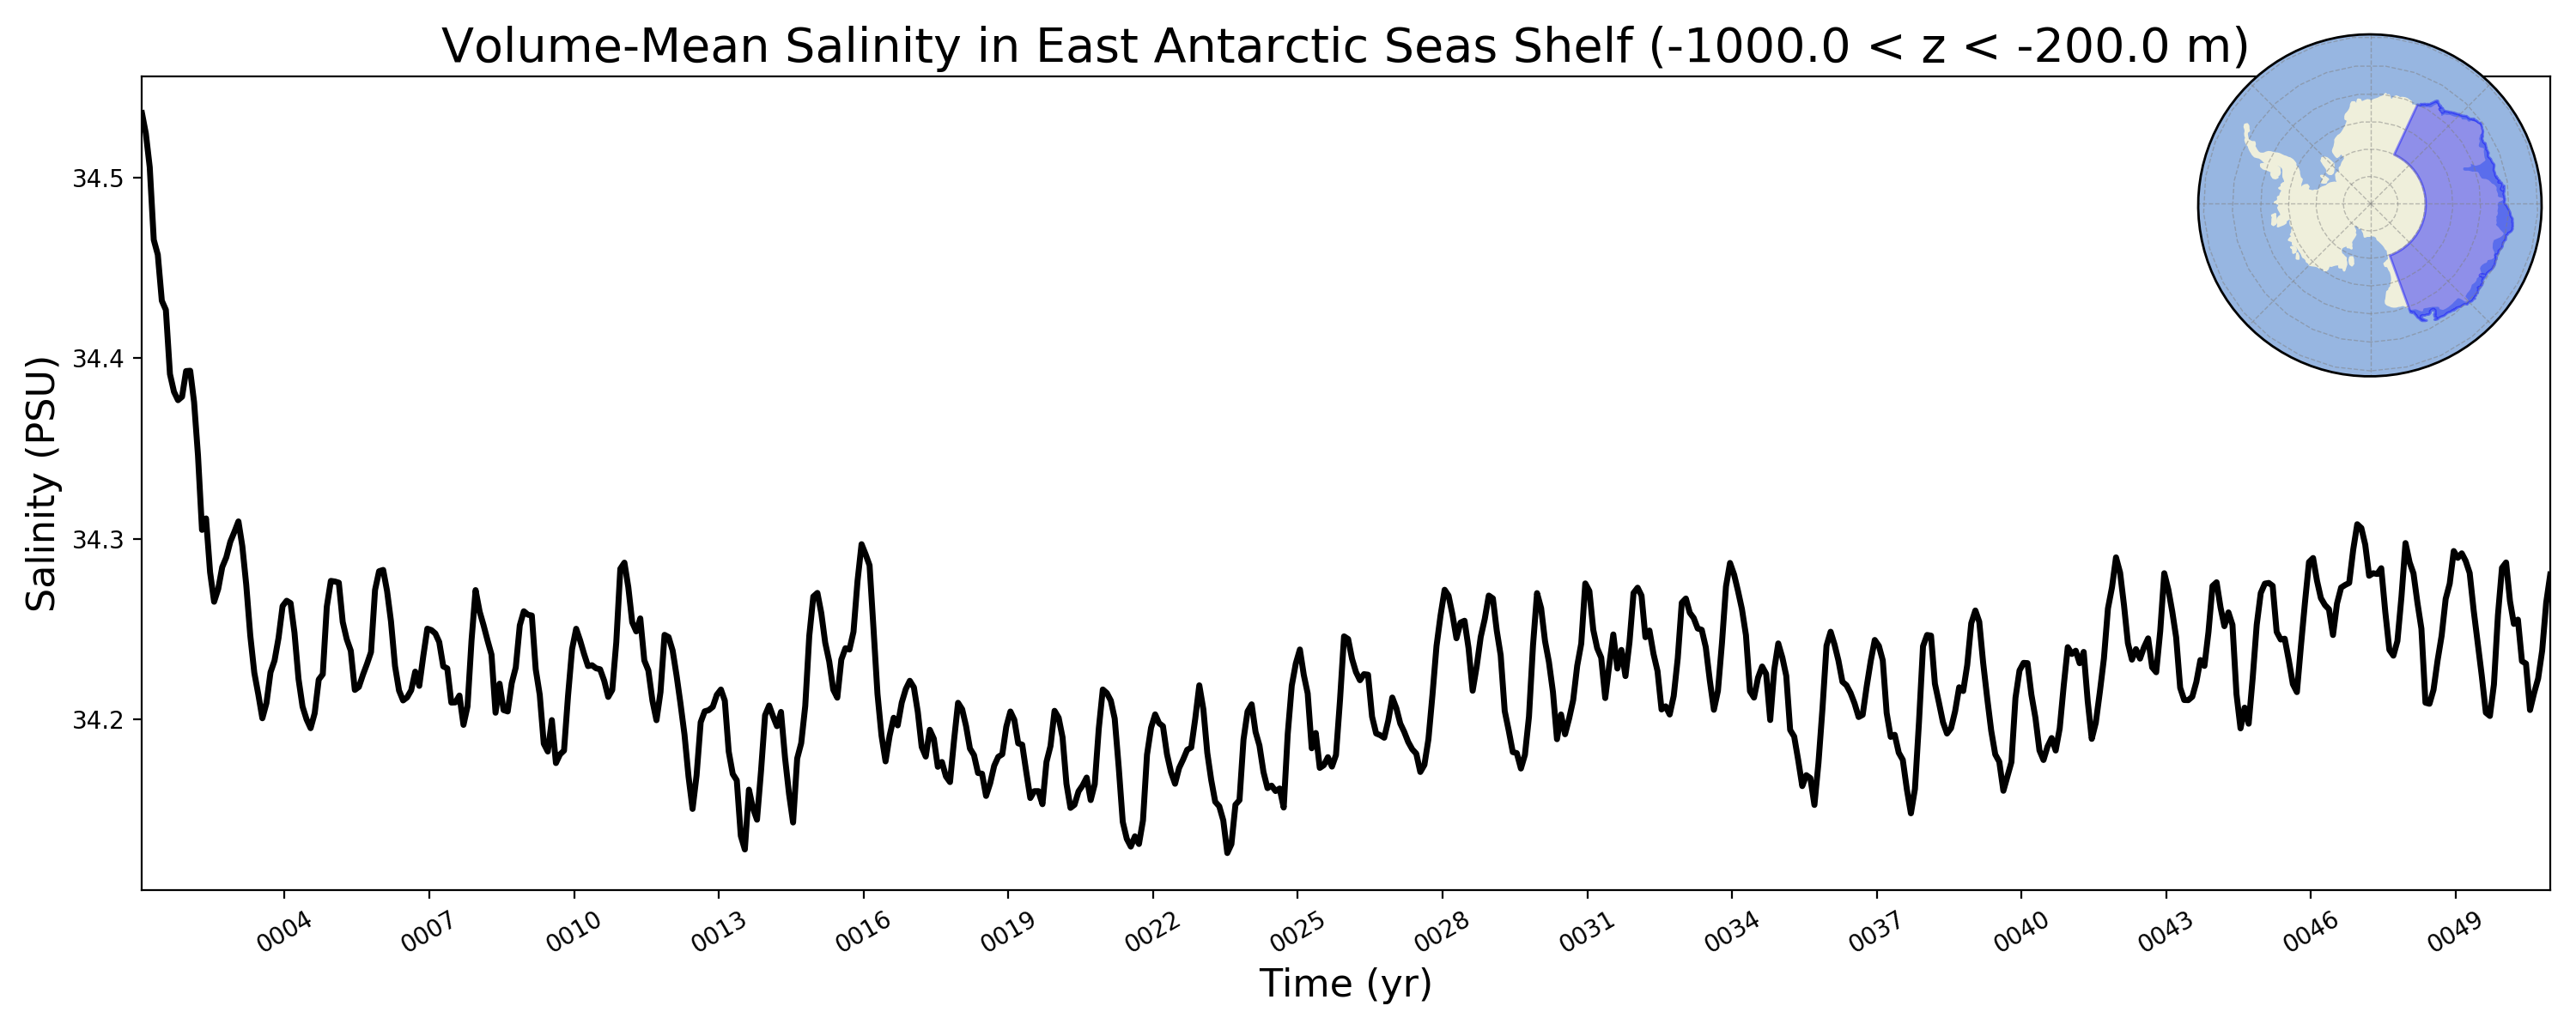
East Antarctic Seas Shelf
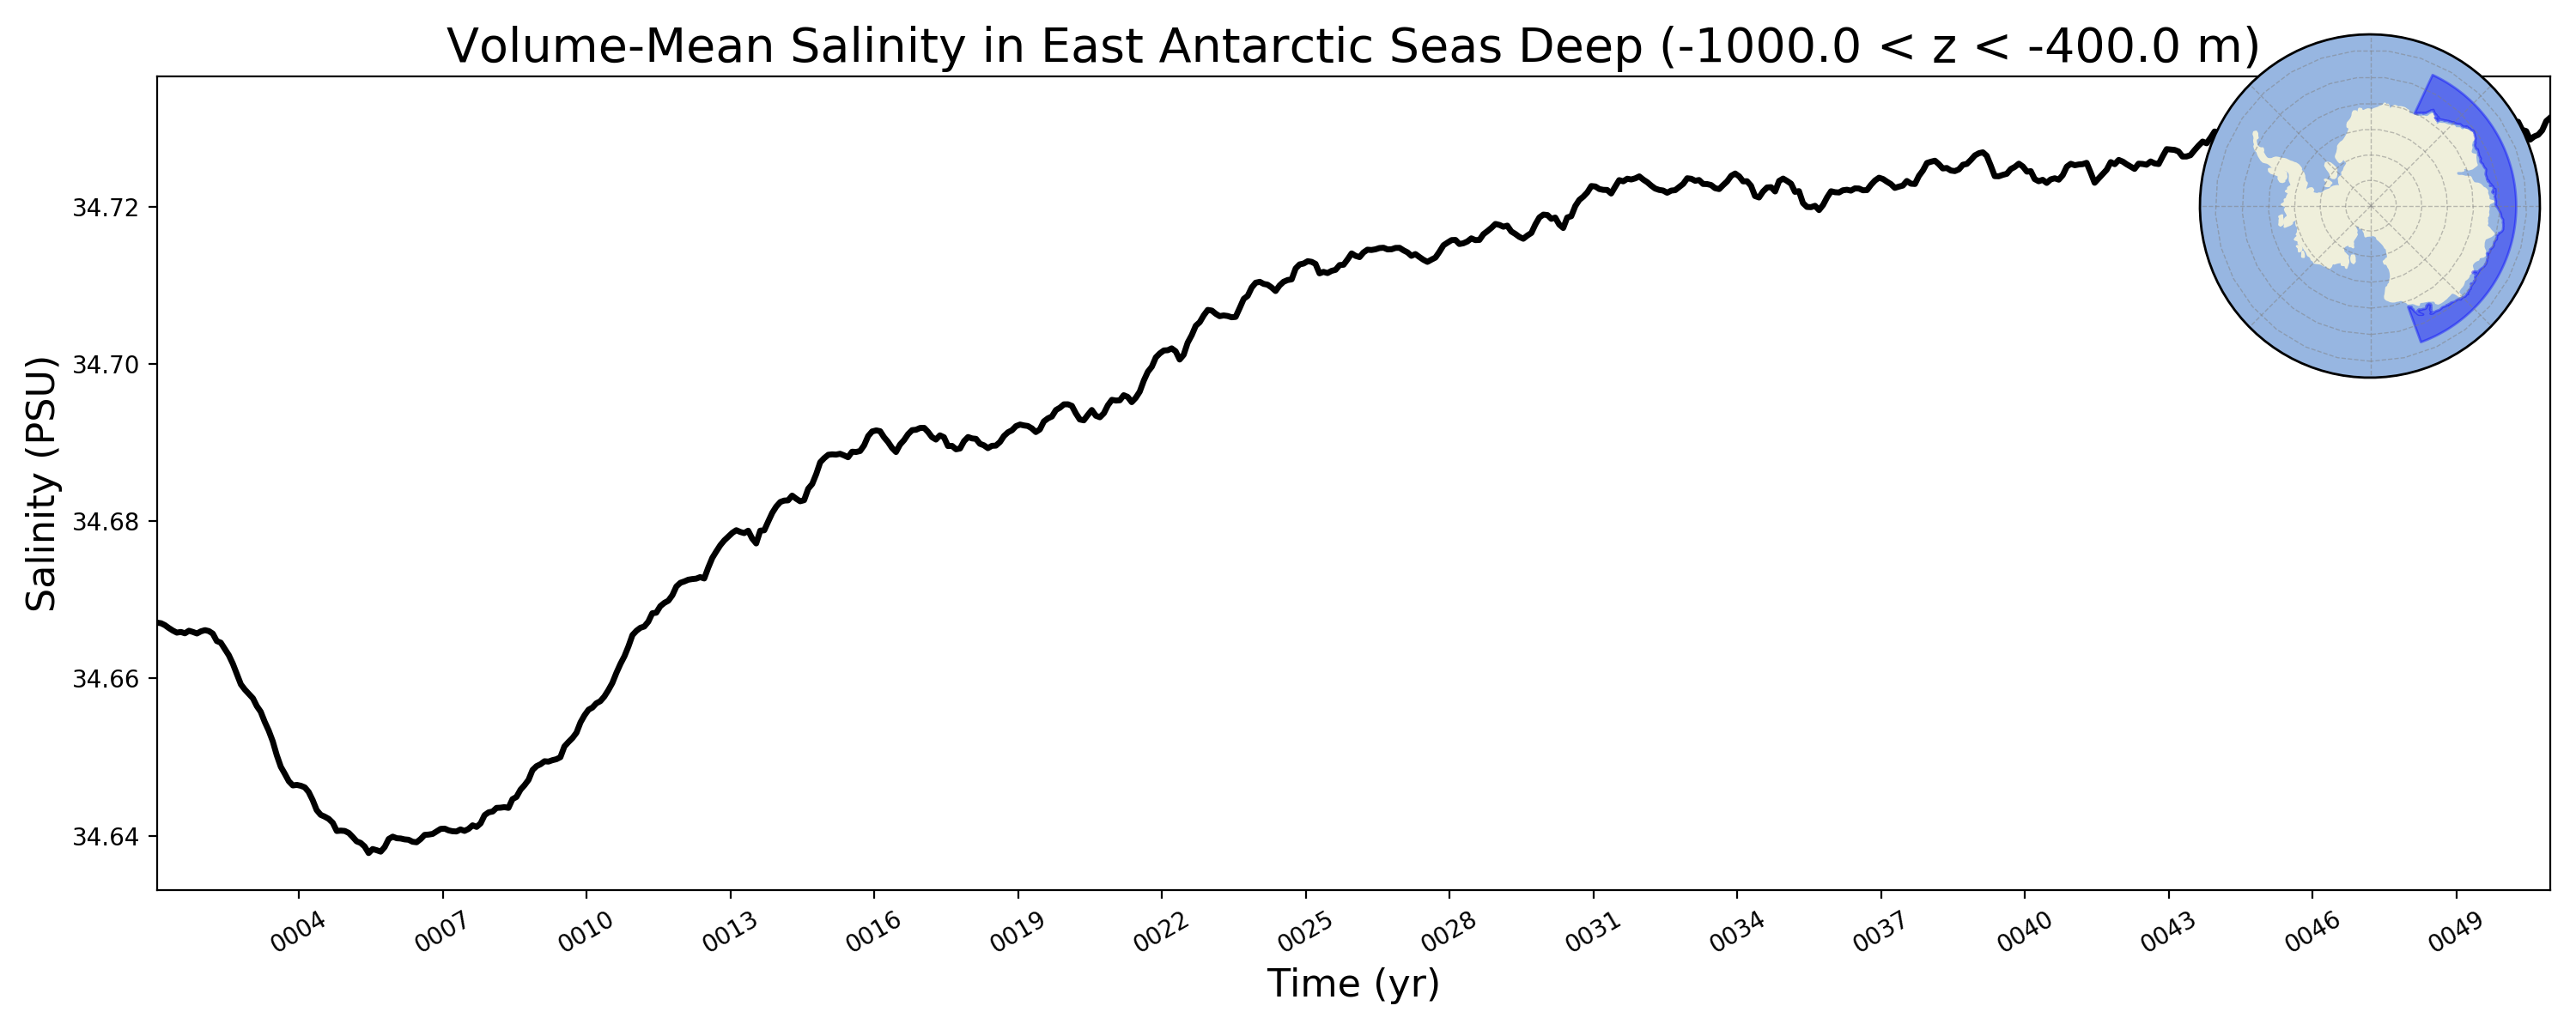
East Antarctic Seas Deep
Potential Density
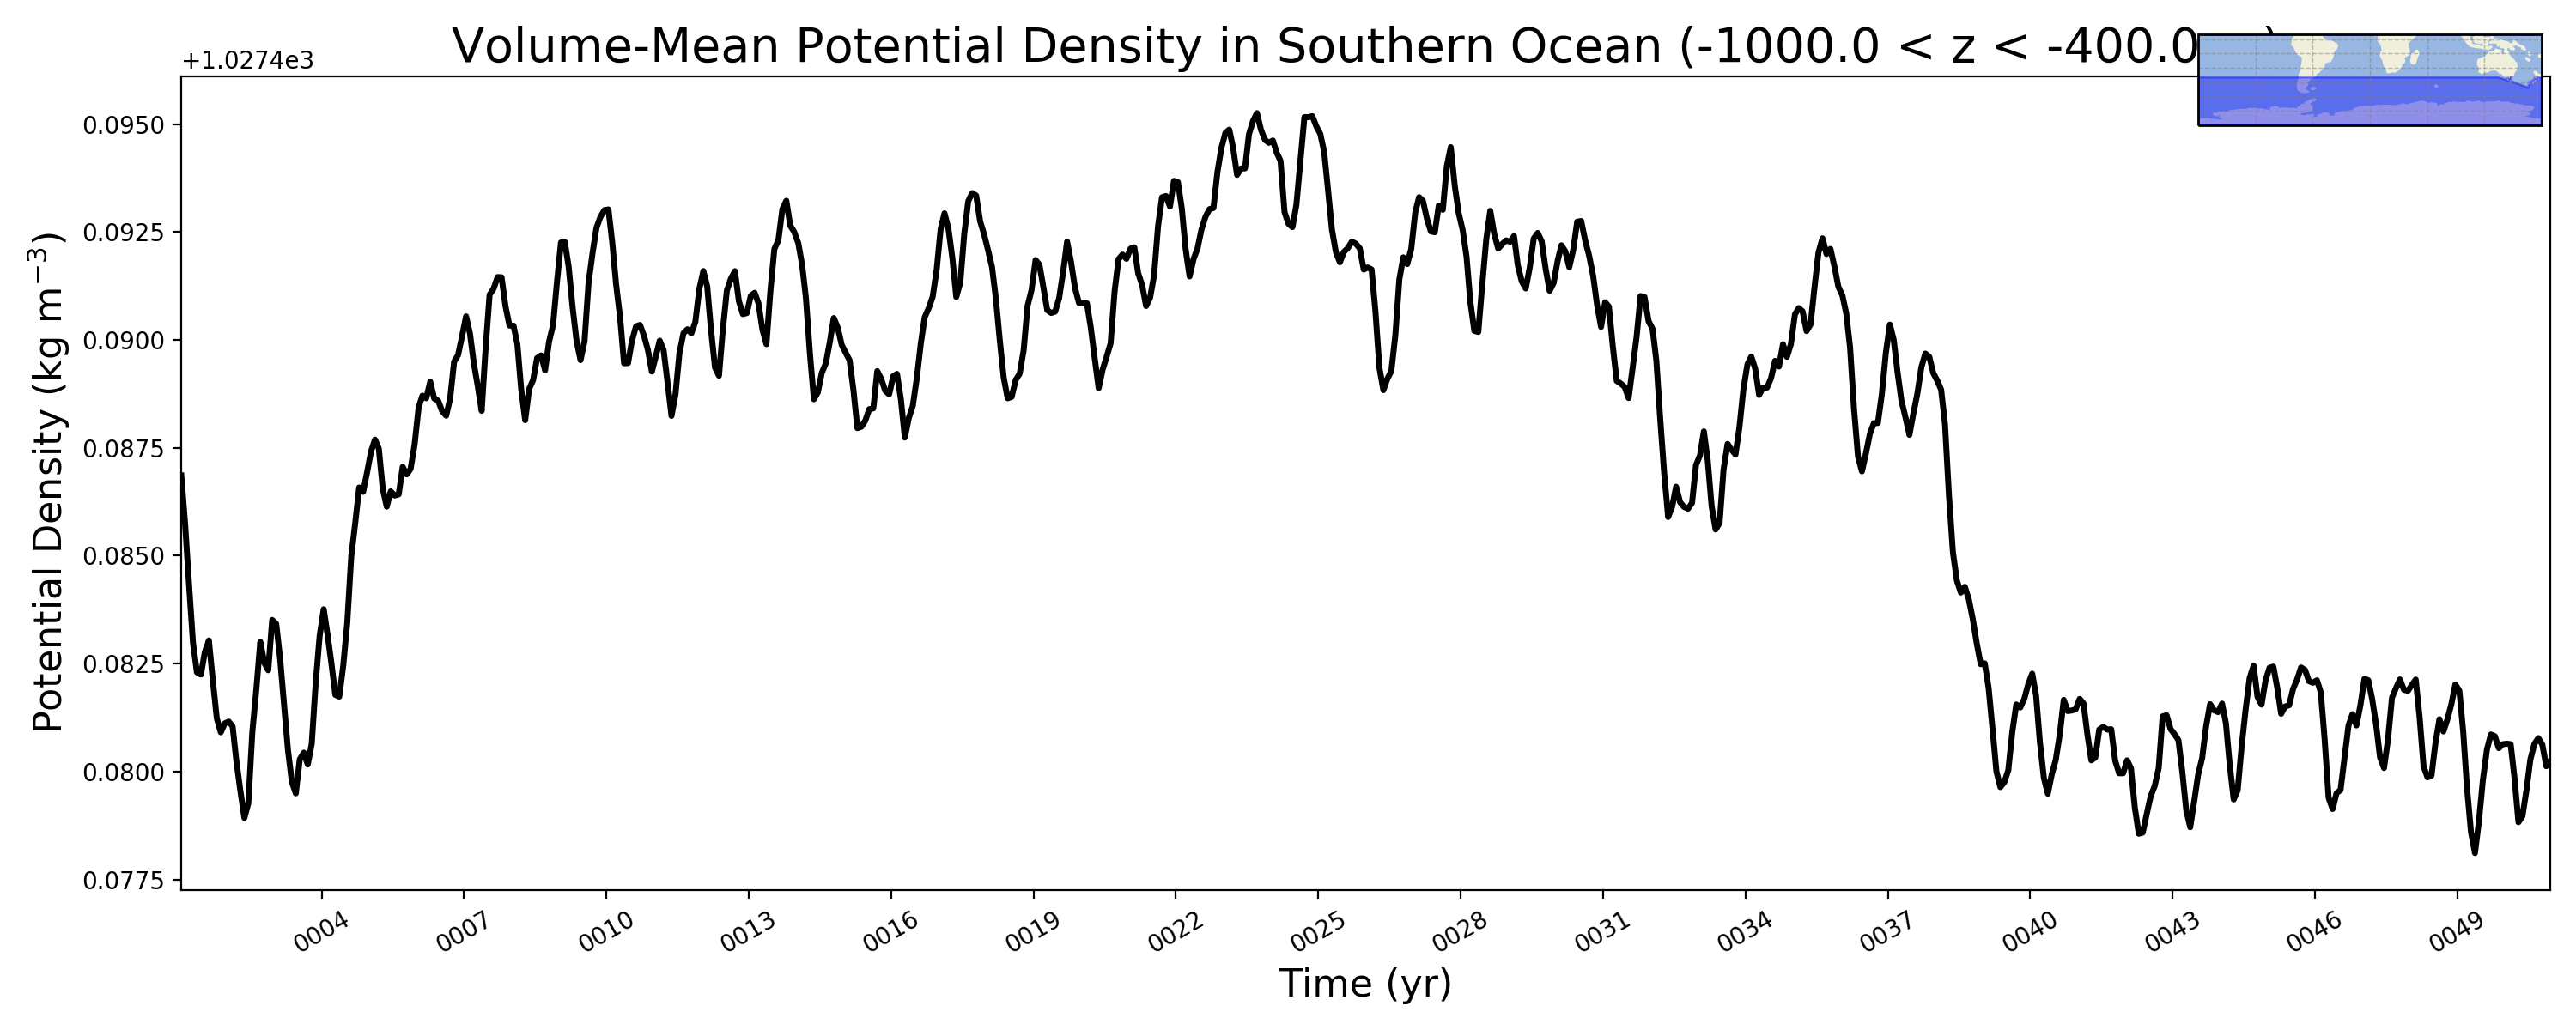
Southern Ocean
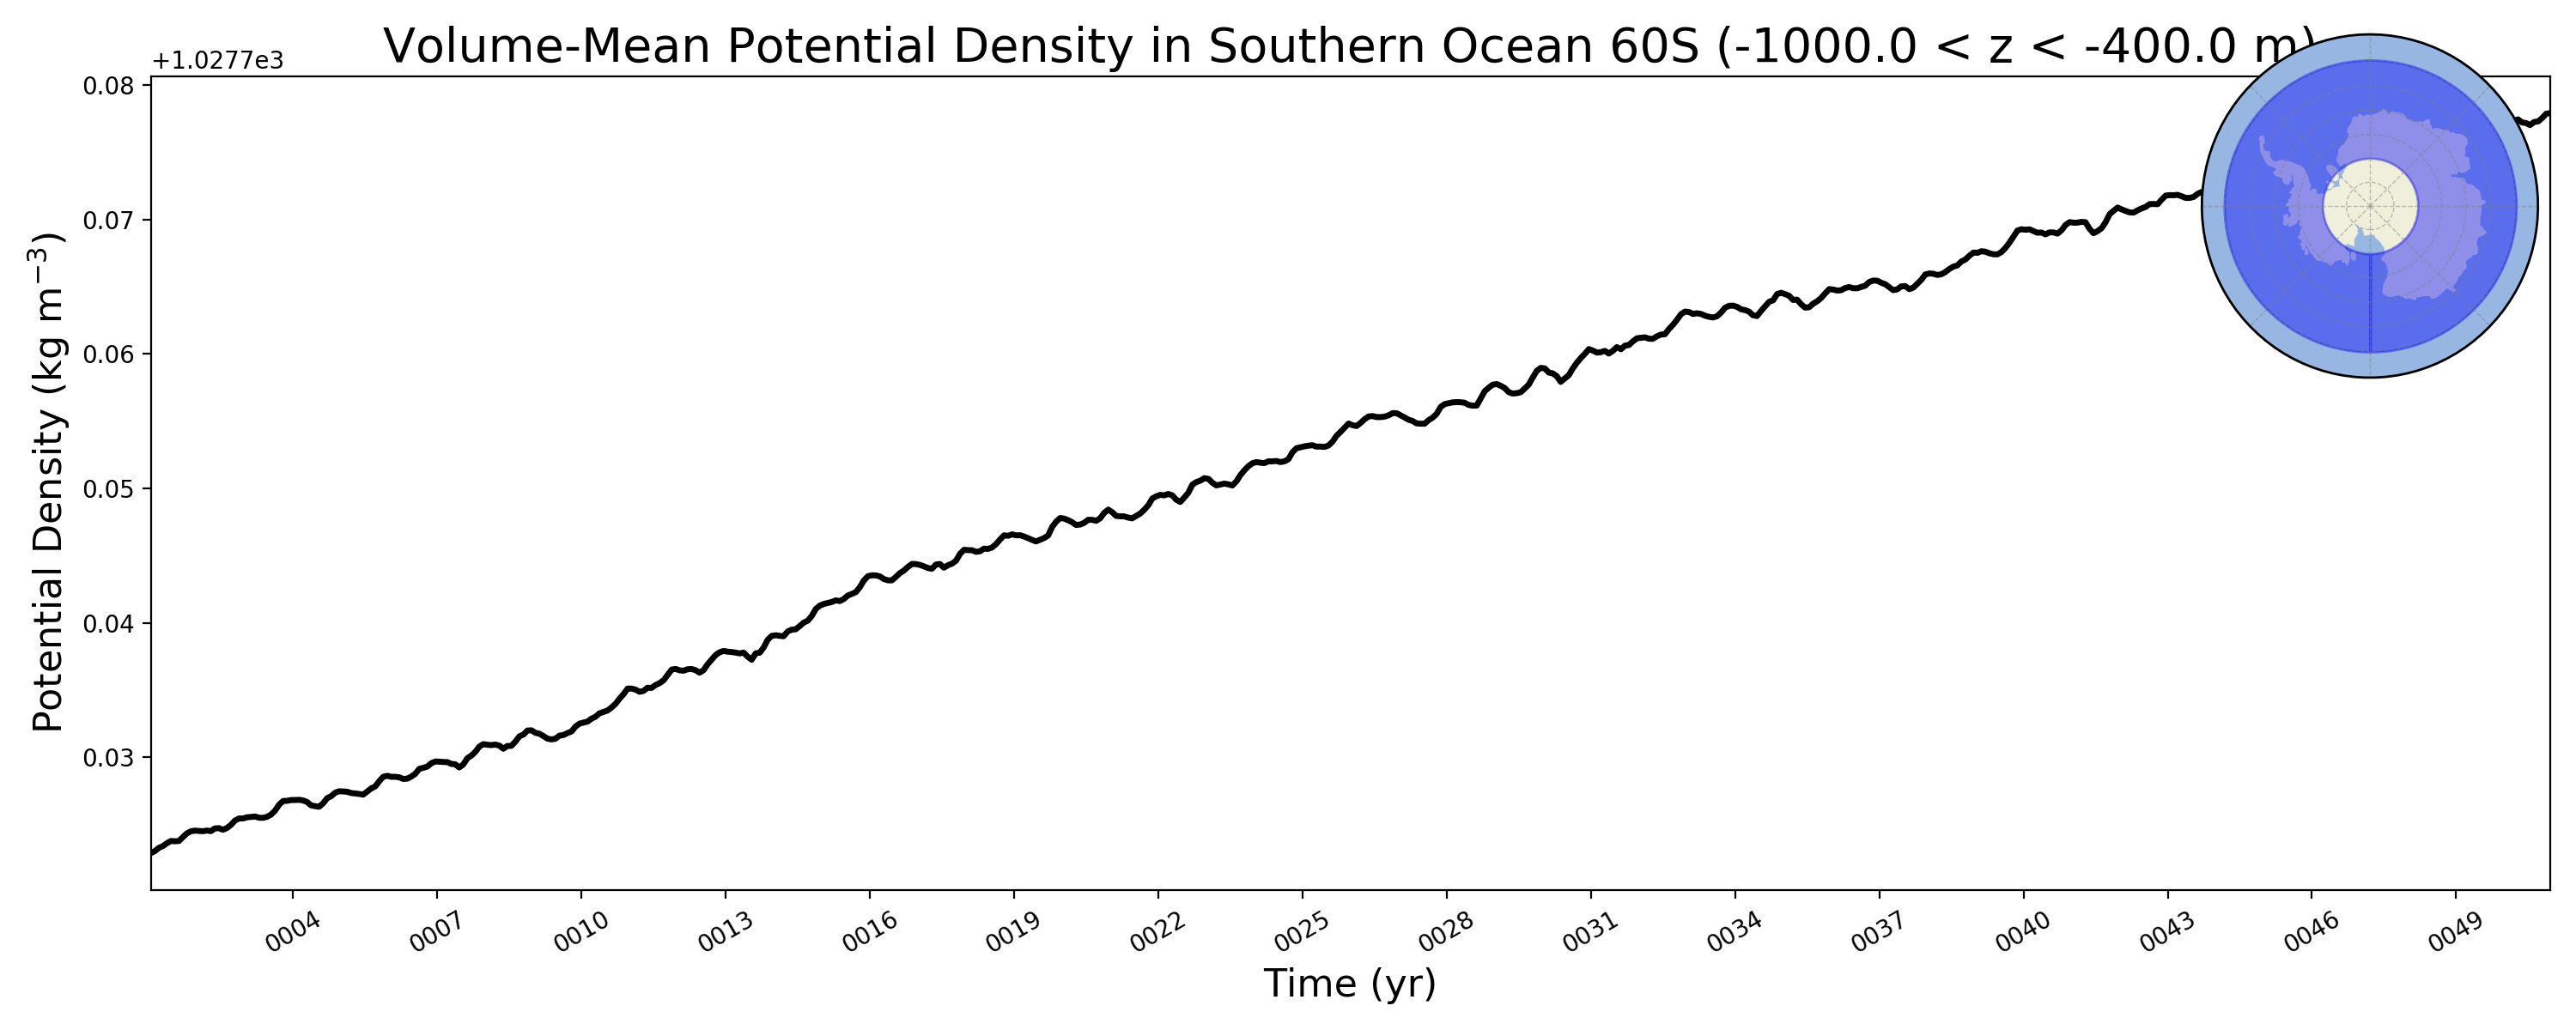
Southern Ocean 60S
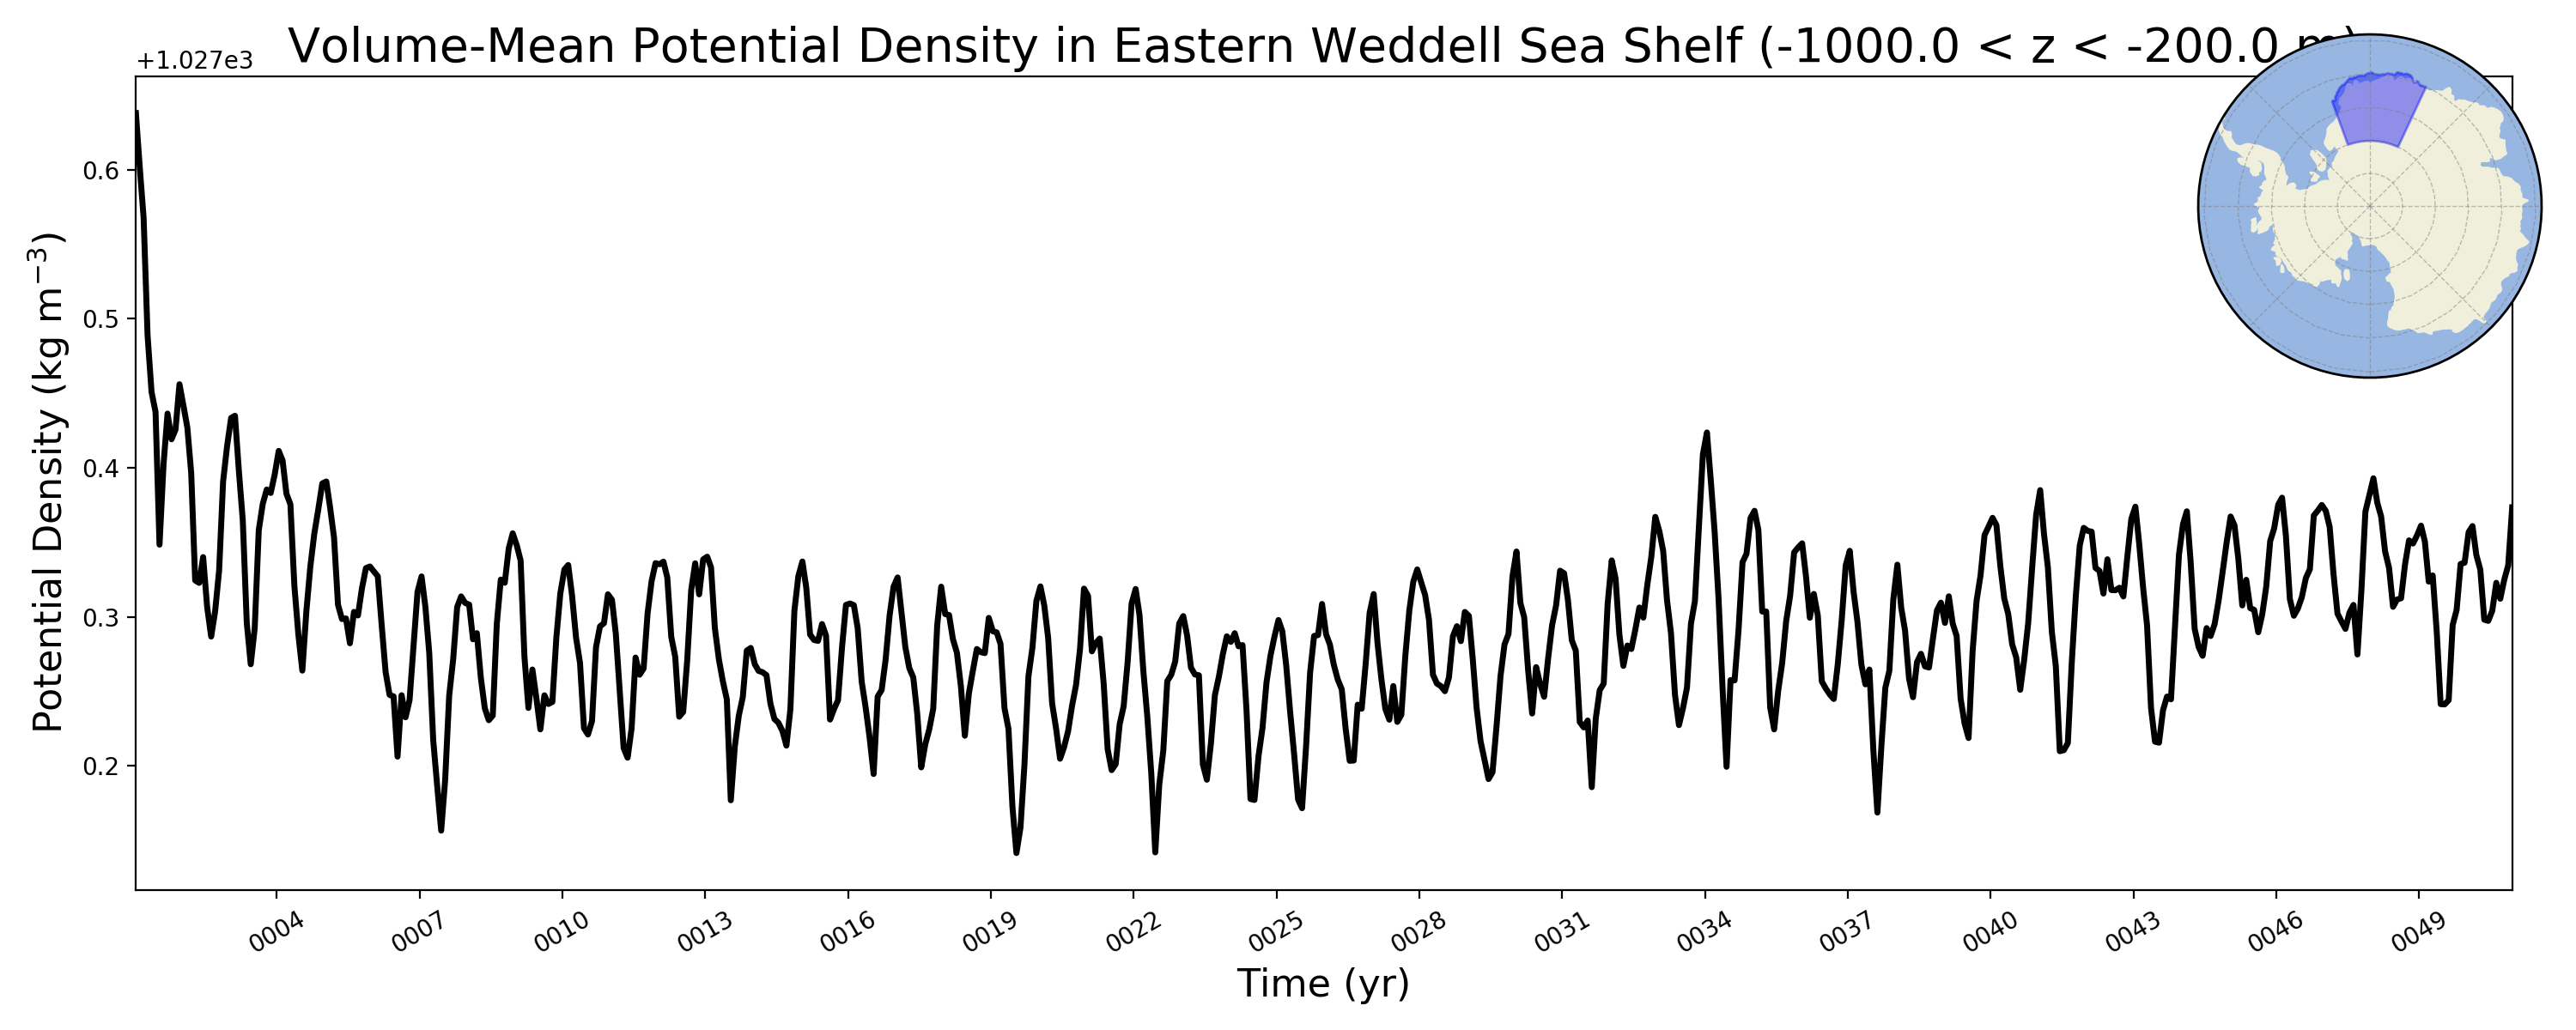
Eastern Weddell Sea Shelf
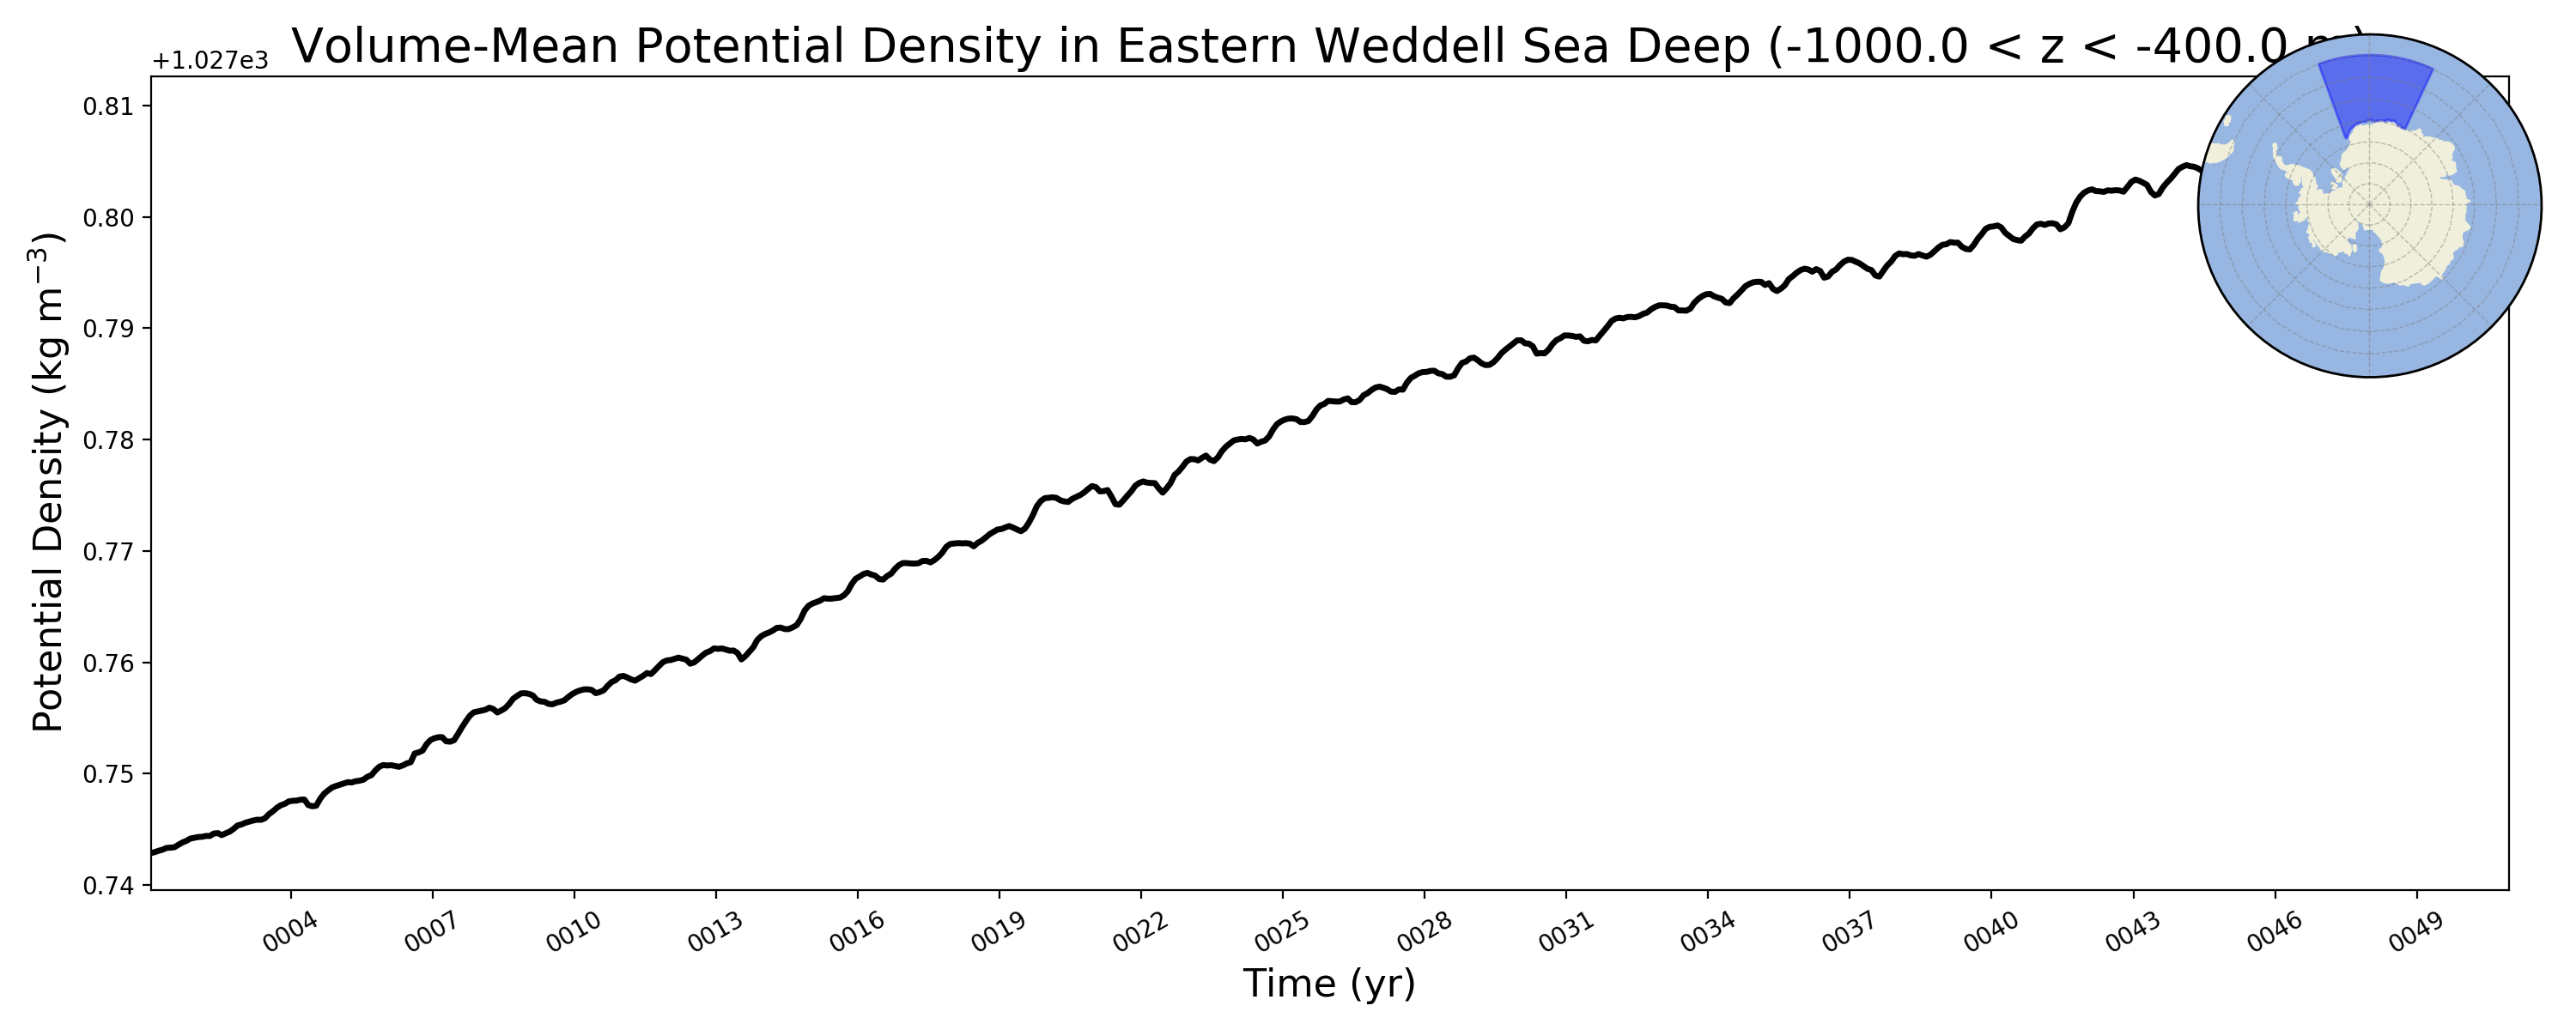
Eastern Weddell Sea Deep
Western Weddell Sea Shelf
Western Weddell Sea Deep
Weddell Sea Shelf
Weddell Sea Deep
Bellingshausen Sea Shelf
Bellingshausen Sea Deep
Amundsen Sea Shelf
Amundsen Sea Deep
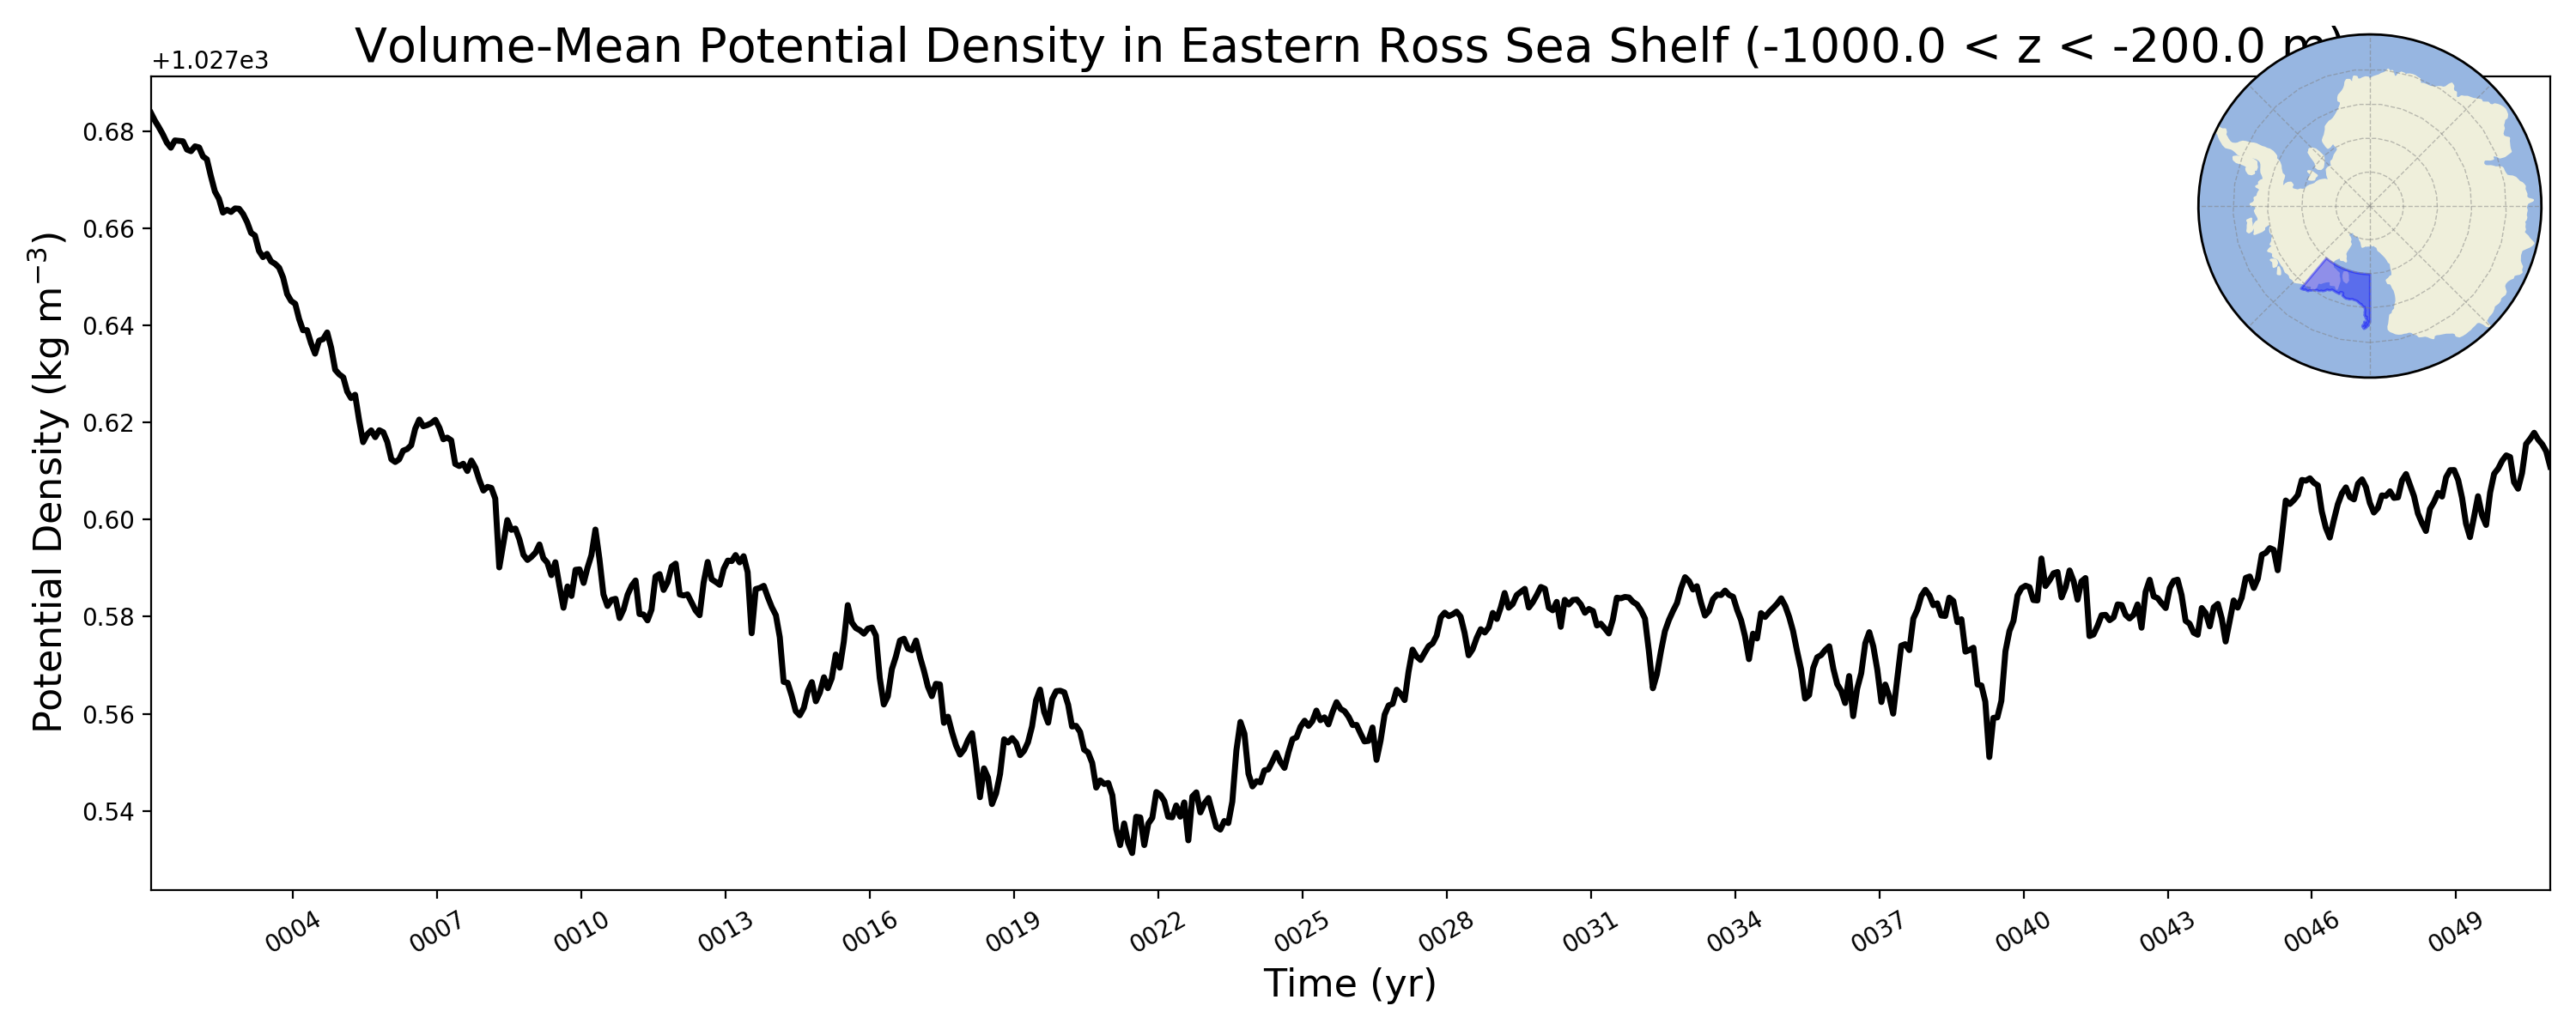
Eastern Ross Sea Shelf
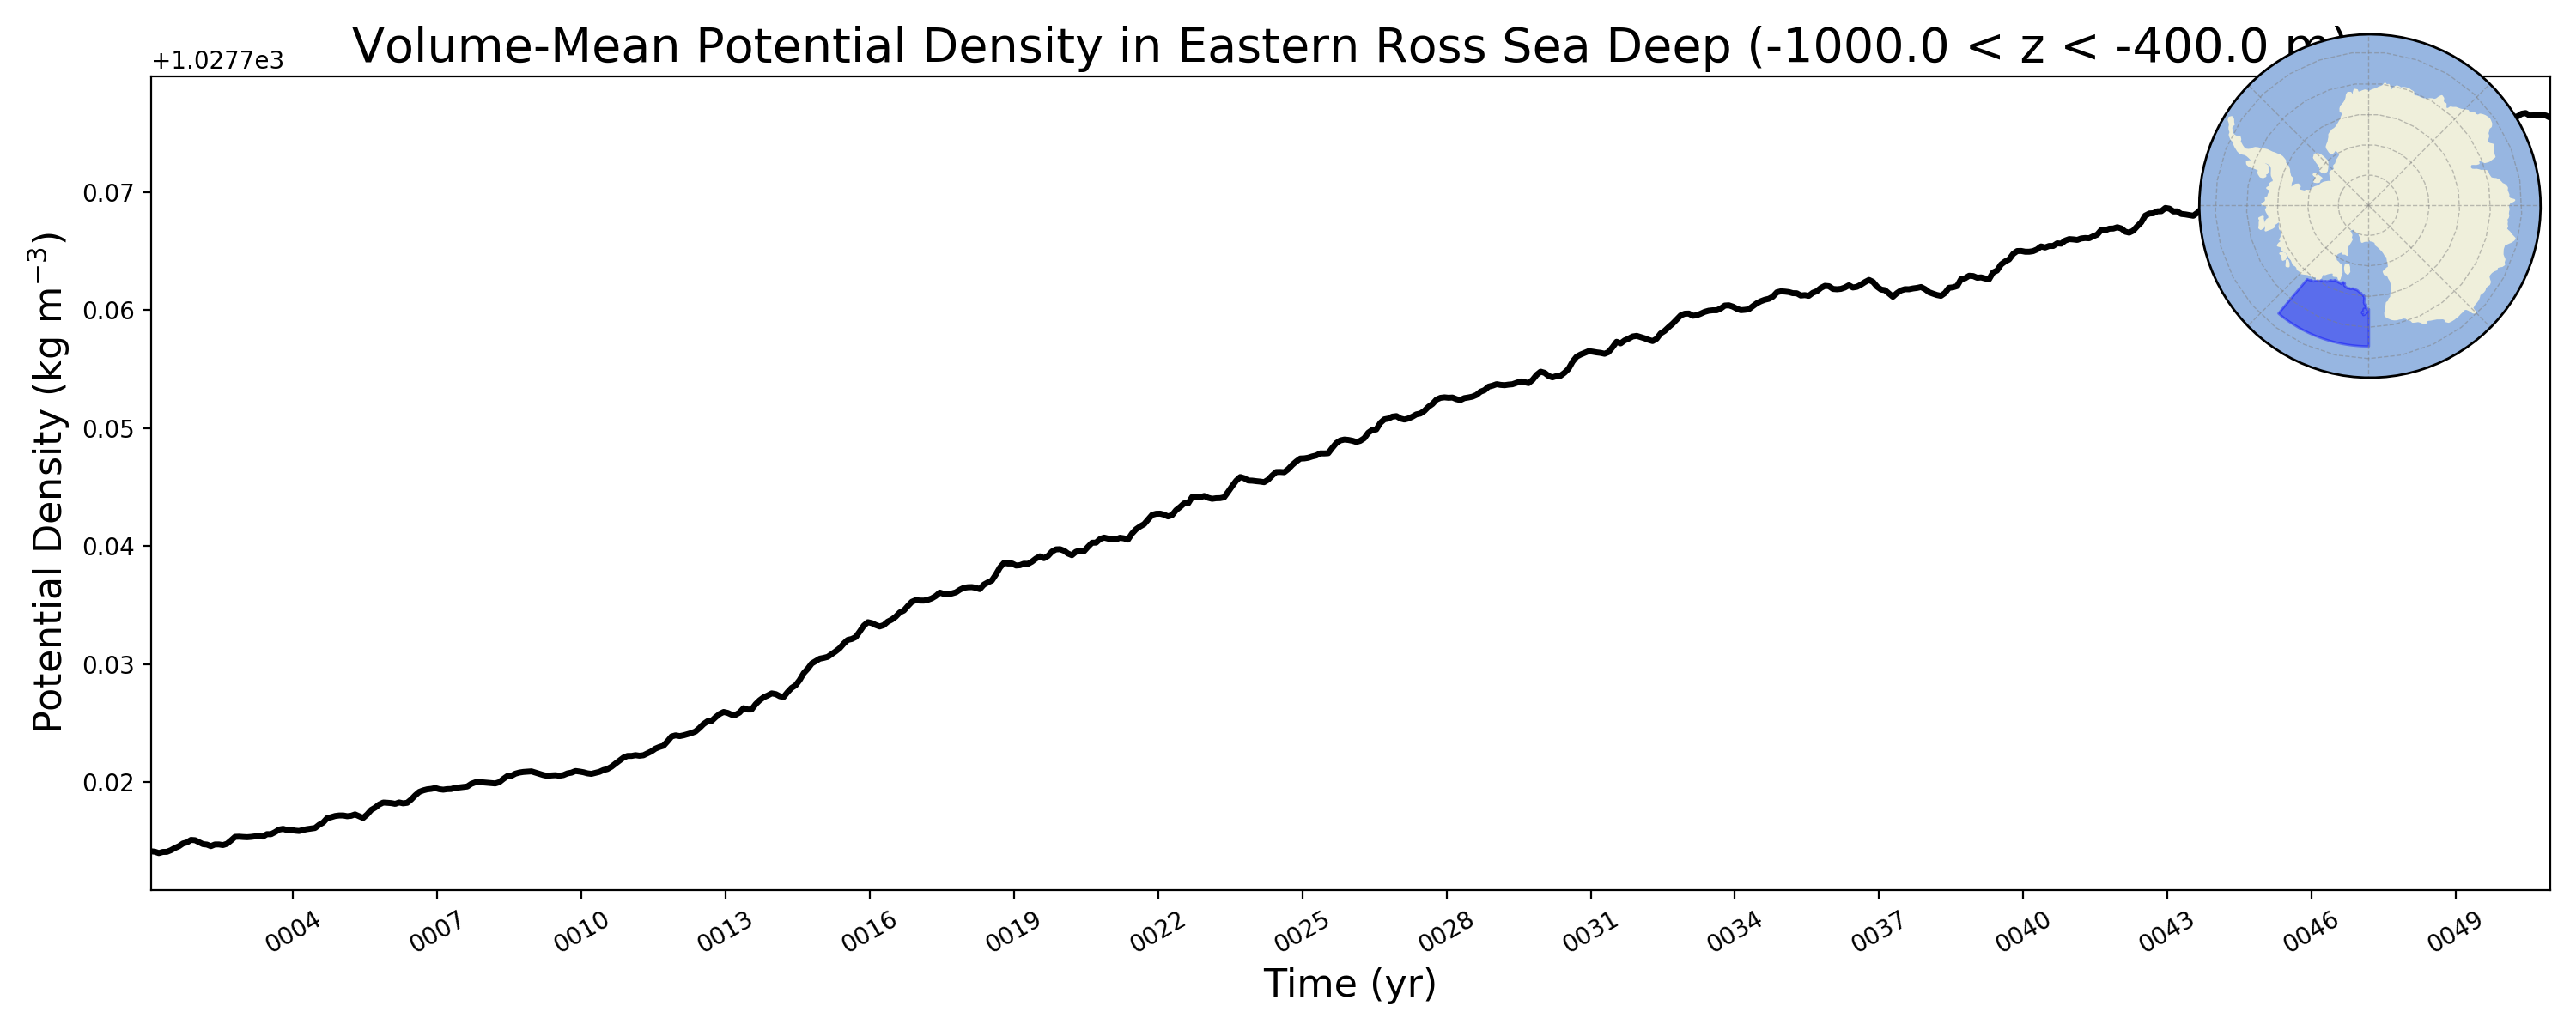
Eastern Ross Sea Deep
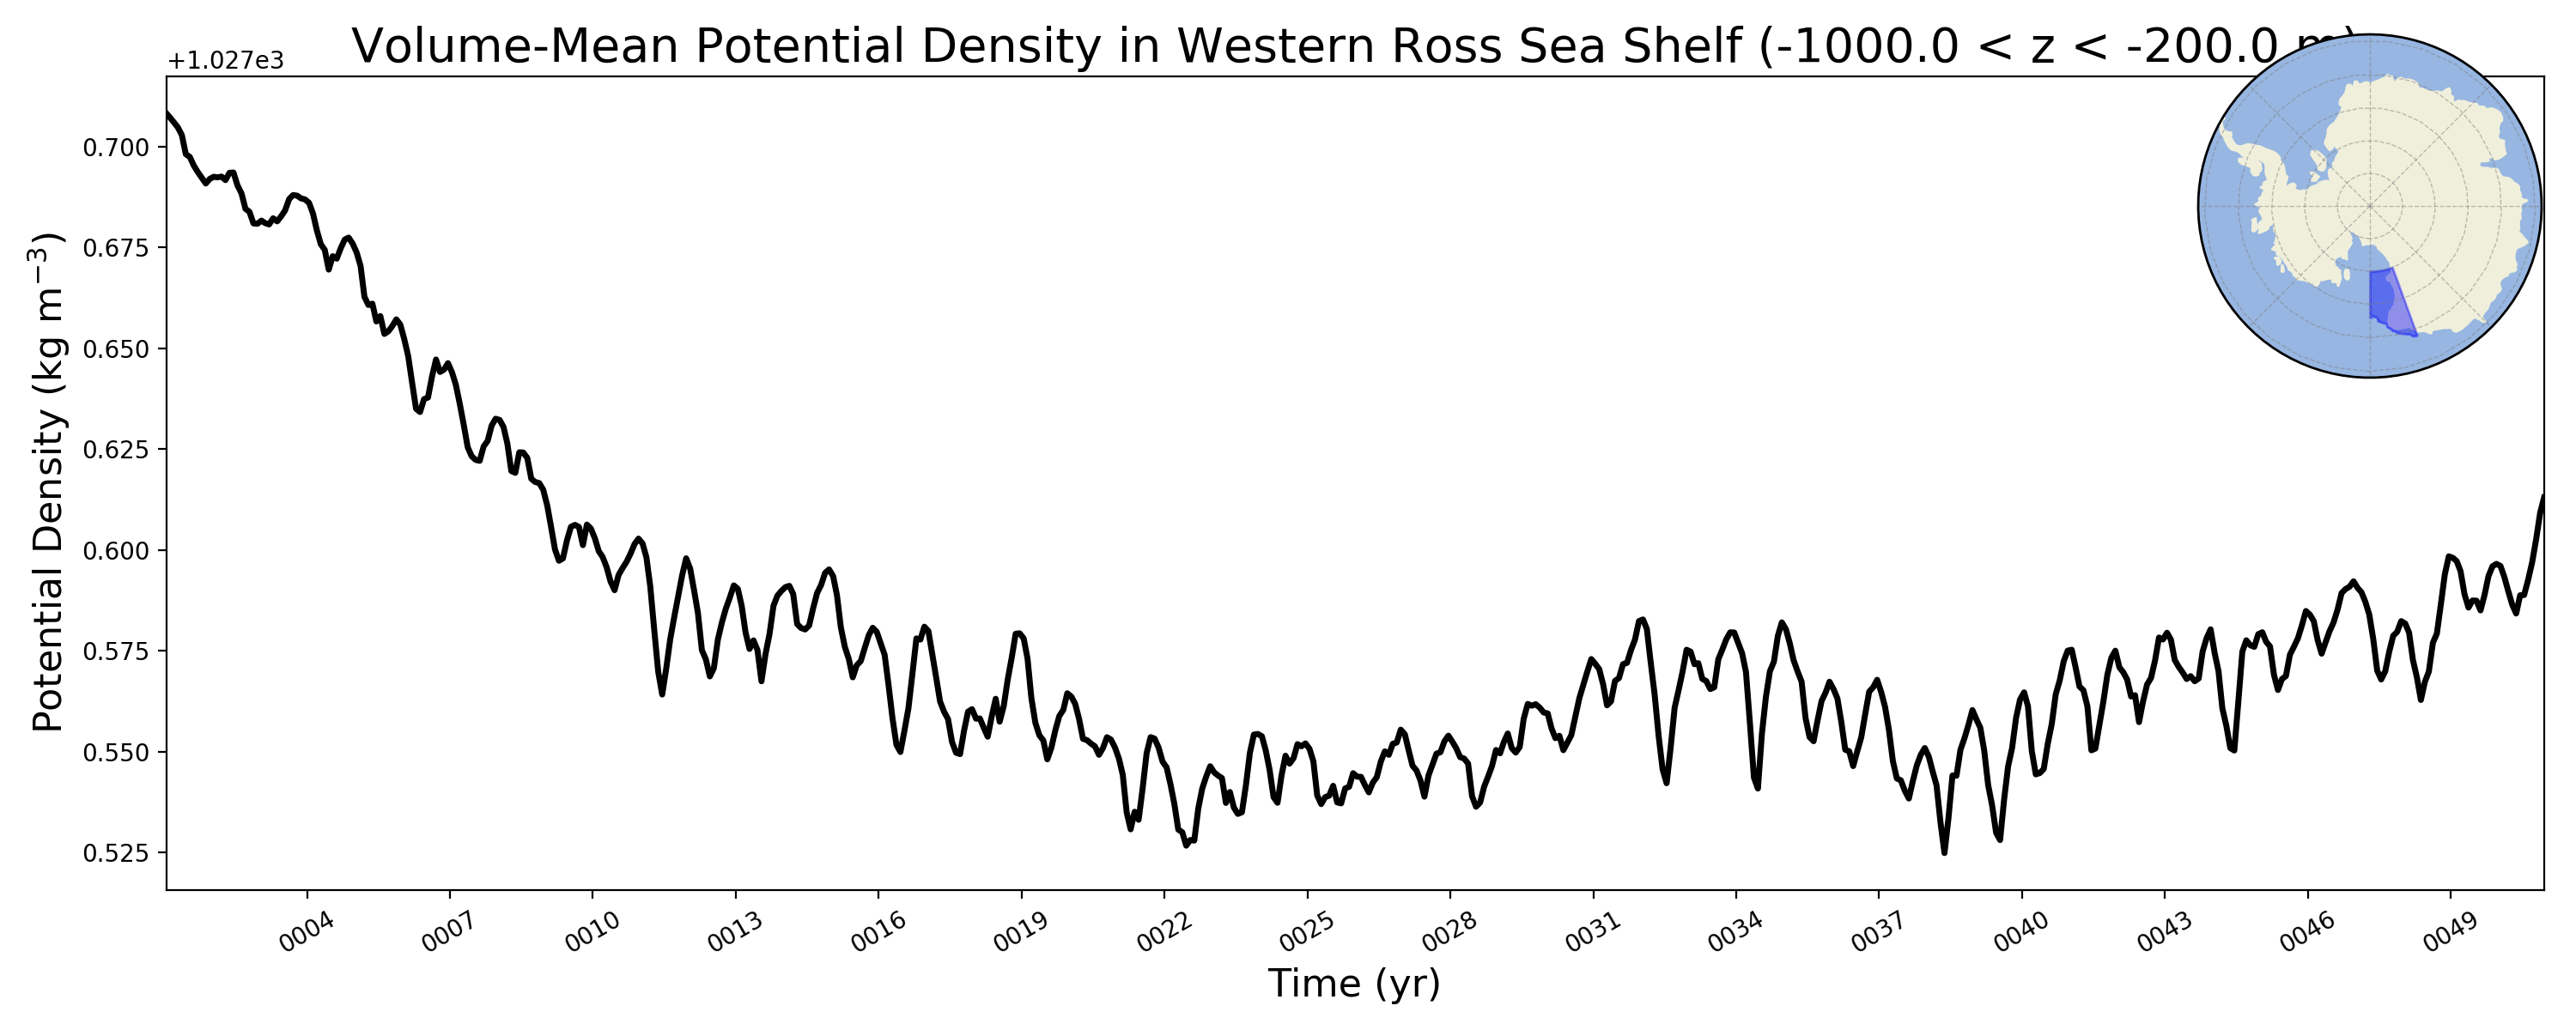
Western Ross Sea Shelf
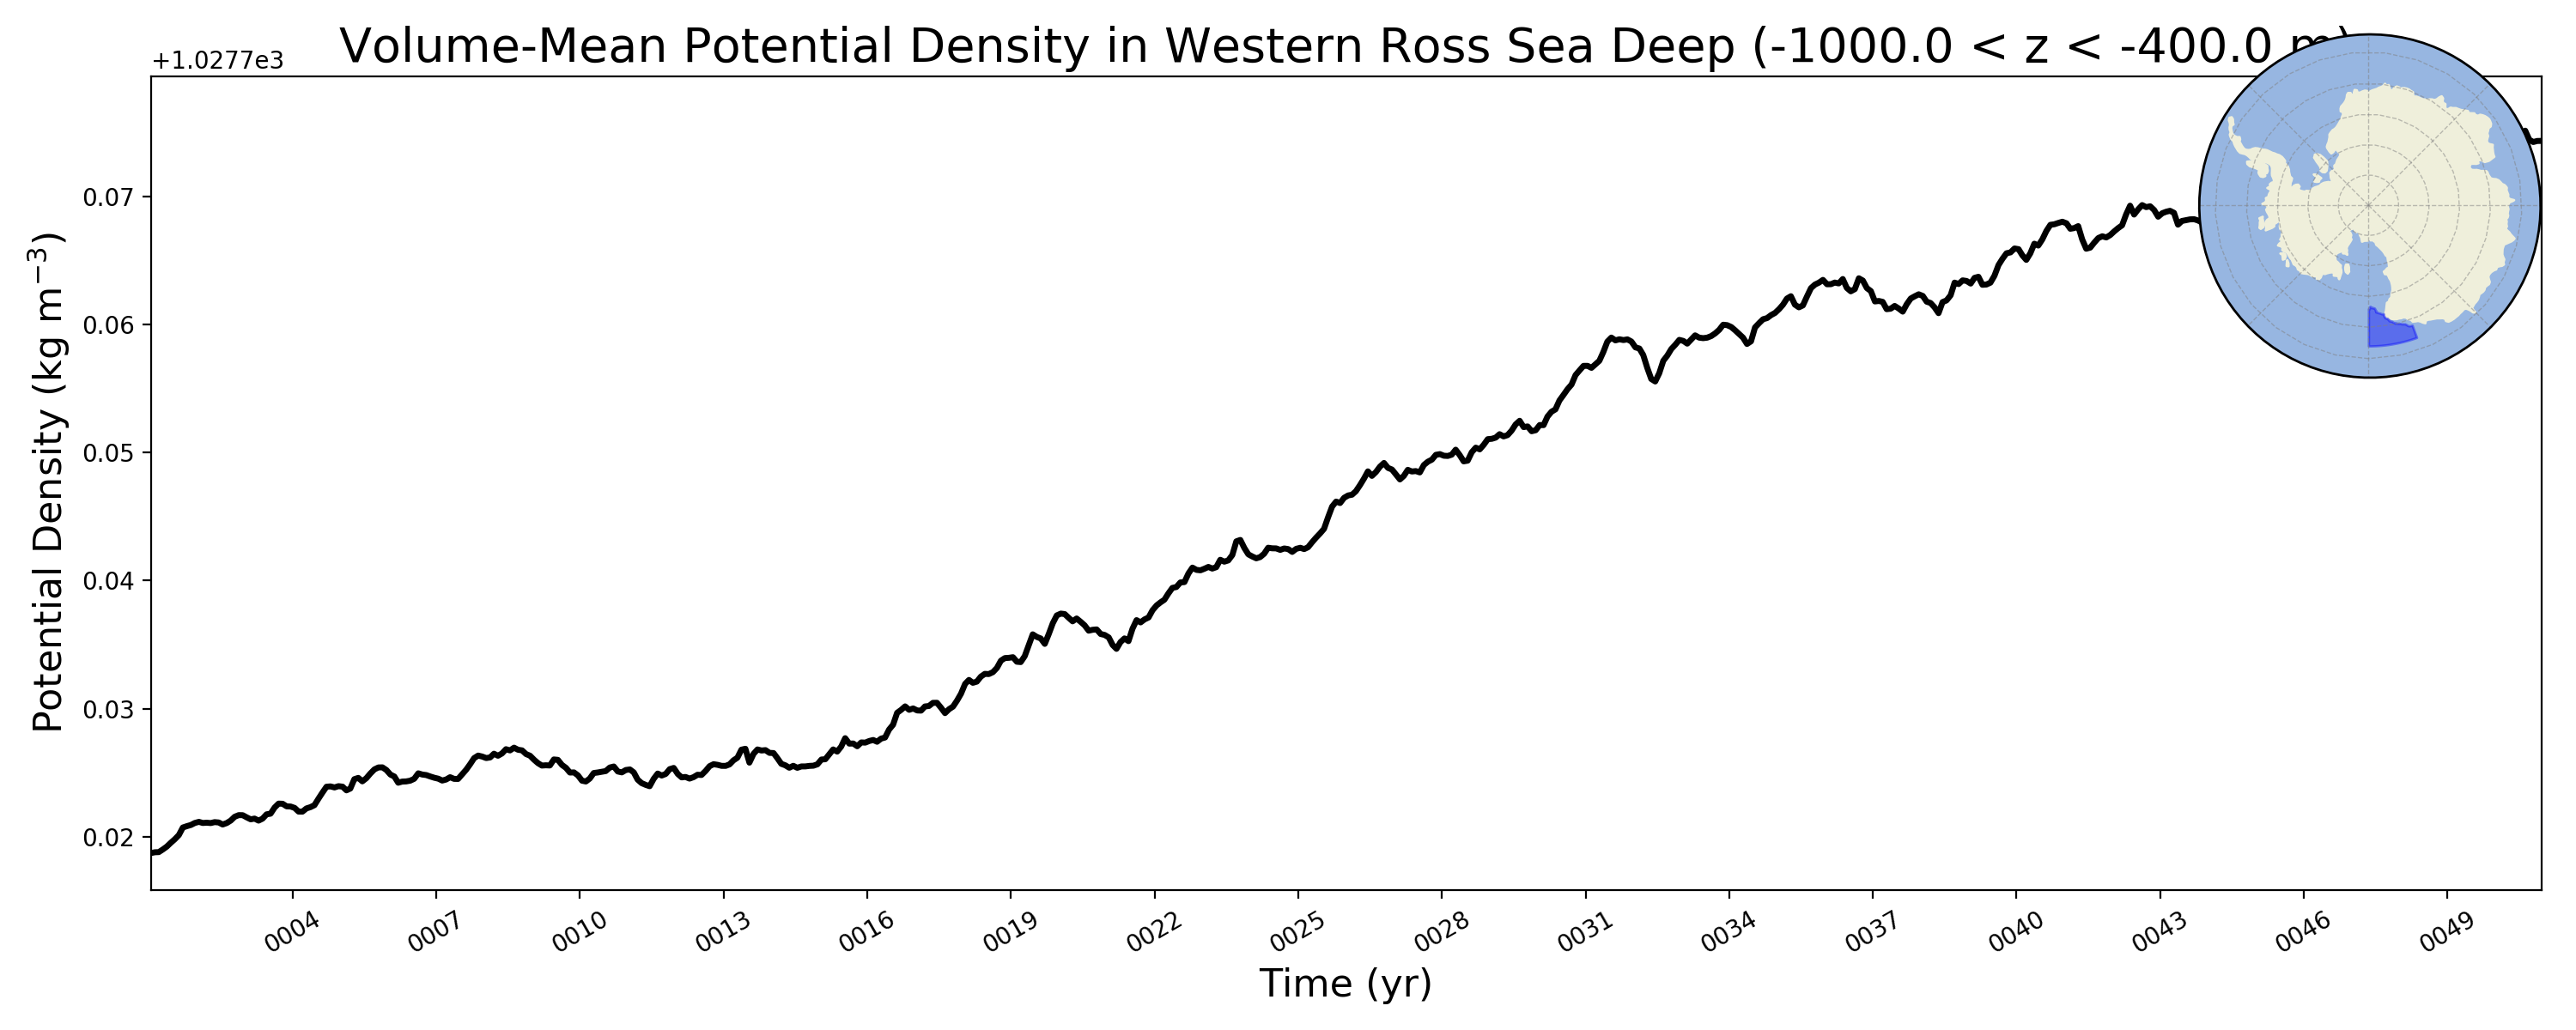
Western Ross Sea Deep
East Antarctic Seas Shelf
East Antarctic Seas Deep

Global Ocean Δϴ

Global Ocean ΔS

Global Ocean ΔOHC

global ΔOHC

global SST


Global

Atlantic

Time Series

Time Series

Spectra
Potential Temperature

ANN

ANN

ANN
Salinity

ANN

ANN

ANN
Potential Density

ANN

ANN

ANN
Potential Temperature

ANN

JFM

JAS

ANN

JFM

JAS

ANN

JFM

JAS

ANN

JFM

JAS

ANN

JFM

JAS

ANN

JFM

JAS

ANN

JFM

JAS
Salinity

ANN

JFM

JAS

ANN

JFM

JAS

ANN

JFM

JAS

ANN

JFM

JAS

ANN

JFM

JAS

ANN

JFM

JAS

ANN

JFM

JAS
Potential Density

ANN

JFM

JAS

ANN

JFM

JAS

ANN

JFM

JAS

ANN

JFM

JAS

ANN

JFM

JAS

ANN

JFM

JAS

ANN

JFM

JAS
Zonal Velocity

ANN

JFM

JAS

ANN

JFM

JAS

ANN

JFM

JAS

ANN

JFM

JAS

ANN

JFM

JAS

ANN

JFM

JAS

ANN

JFM

JAS
Meridional Velocity

ANN

JFM

JAS

ANN

JFM

JAS

ANN

JFM

JAS

ANN

JFM

JAS

ANN

JFM

JAS

ANN

JFM

JAS

ANN

JFM

JAS
Velocity Magnitude

ANN

JFM

JAS

ANN

JFM

JAS

ANN

JFM

JAS

ANN

JFM

JAS

ANN

JFM

JAS

ANN

JFM

JAS

ANN

JFM

JAS
Potential Temperature

Atlantic Basin JFM

Atlantic Basin JAS

Atlantic Basin ANN

Pacific Basin JFM

Pacific Basin JAS

Pacific Basin ANN

Indian Basin JFM

Indian Basin JAS

Indian Basin ANN

Arctic Basin JFM

Arctic Basin JAS

Arctic Basin ANN

Southern Ocean Basin JFM

Southern Ocean Basin JAS

Southern Ocean Basin ANN

Mediterranean Basin JFM

Mediterranean Basin JAS

Mediterranean Basin ANN

Global Ocean JFM

Global Ocean JAS

Global Ocean ANN

Global Ocean 65N to 65S JFM

Global Ocean 65N to 65S JAS

Global Ocean 65N to 65S ANN

Global Ocean 15S to 15N JFM

Global Ocean 15S to 15N JAS

Global Ocean 15S to 15N ANN
Salinity

Atlantic Basin JFM

Atlantic Basin JAS

Atlantic Basin ANN

Pacific Basin JFM

Pacific Basin JAS

Pacific Basin ANN

Indian Basin JFM

Indian Basin JAS

Indian Basin ANN

Arctic Basin JFM

Arctic Basin JAS

Arctic Basin ANN

Southern Ocean Basin JFM

Southern Ocean Basin JAS

Southern Ocean Basin ANN

Mediterranean Basin JFM

Mediterranean Basin JAS

Mediterranean Basin ANN

Global Ocean JFM

Global Ocean JAS

Global Ocean ANN

Global Ocean 65N to 65S JFM

Global Ocean 65N to 65S JAS

Global Ocean 65N to 65S ANN

Global Ocean 15S to 15N JFM

Global Ocean 15S to 15N JAS

Global Ocean 15S to 15N ANN
Potential Density

Atlantic Basin JFM

Atlantic Basin JAS

Atlantic Basin ANN

Pacific Basin JFM

Pacific Basin JAS

Pacific Basin ANN

Indian Basin JFM

Indian Basin JAS

Indian Basin ANN

Arctic Basin JFM

Arctic Basin JAS

Arctic Basin ANN

Southern Ocean Basin JFM

Southern Ocean Basin JAS

Southern Ocean Basin ANN

Mediterranean Basin JFM

Mediterranean Basin JAS

Mediterranean Basin ANN

Global Ocean JFM

Global Ocean JAS

Global Ocean ANN

Global Ocean 65N to 65S JFM

Global Ocean 65N to 65S JAS

Global Ocean 65N to 65S ANN

Global Ocean 15S to 15N JFM

Global Ocean 15S to 15N JAS

Global Ocean 15S to 15N ANN