Mean State
Download Data |
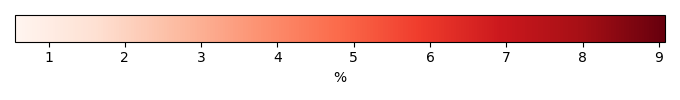
Period Mean (original grids) [%] |
Model Period Mean (intersection) [%] |
Model Period Mean (complement) [%] |
Benchmark Period Mean (intersection) [%] |
Benchmark Period Mean (complement) [%] |
Bias [%] |
RMSE [%] |
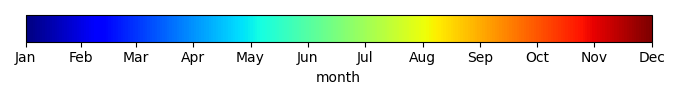
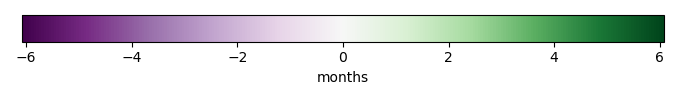
Phase Shift [months] |
Bias Score [1] |
RMSE Score [1] |
Seasonal Cycle Score [1] |
Spatial Distribution Score [1] |
Interannual Variability Score [1] |
Overall Score [1] |
|||
|---|---|---|---|---|---|---|---|---|---|---|---|---|---|---|---|---|---|
| Benchmark | [-] | 59.7 | |||||||||||||||
| CESM2 | [-] | 49.0 | 49.0 | 50.2 | 75.4 | 1.26 | 6.60 | 0.478 | 0.746 | 0.574 | 0.916 | 0.995 | 0.816 | 0.770 | |||
| ELM_CN | [-] | 50.5 | 50.5 | 47.5 | 74.7 | 3.29 | 7.23 | 0.361 | 0.757 | 0.605 | 0.941 | 0.987 | 0.838 | 0.789 | |||
| ELM_CNP | [-] | 50.5 | 50.5 | 47.5 | 74.7 | 3.28 | 7.22 | 0.361 | 0.757 | 0.606 | 0.941 | 0.987 | 0.837 | 0.789 |
Download Data |
Period Mean (original grids) [%] |
Model Period Mean (intersection) [%] |
Model Period Mean (complement) [%] |
Benchmark Period Mean (intersection) [%] |
Benchmark Period Mean (complement) [%] |
Bias [%] |
RMSE [%] |
Phase Shift [months] |
Bias Score [1] |
RMSE Score [1] |
Seasonal Cycle Score [1] |
Spatial Distribution Score [1] |
Interannual Variability Score [1] |
Overall Score [1] |
|||
|---|---|---|---|---|---|---|---|---|---|---|---|---|---|---|---|---|---|
| Benchmark | [-] | 75.7 | |||||||||||||||
| CESM2 | [-] | 85.6 | 85.6 | 74.8 | 83.1 | 10.9 | 17.3 | 2.09 | 0.236 | 0.166 | 0.700 | 0.929 | 0.831 | 0.505 | |||
| ELM_CN | [-] | 87.8 | 87.8 | 74.5 | 83.0 | 13.3 | 18.9 | 2.53 | 0.175 | 0.167 | 0.611 | 0.914 | 0.863 | 0.483 | |||
| ELM_CNP | [-] | 87.8 | 87.8 | 74.5 | 83.0 | 13.3 | 18.9 | 2.53 | 0.176 | 0.167 | 0.611 | 0.913 | 0.862 | 0.483 |
Download Data |
Period Mean (original grids) [%] |
Model Period Mean (intersection) [%] |
Model Period Mean (complement) [%] |
Benchmark Period Mean (intersection) [%] |
Benchmark Period Mean (complement) [%] |
Bias [%] |
RMSE [%] |
Phase Shift [months] |
Bias Score [1] |
RMSE Score [1] |
Seasonal Cycle Score [1] |
Spatial Distribution Score [1] |
Interannual Variability Score [1] |
Overall Score [1] |
|||
|---|---|---|---|---|---|---|---|---|---|---|---|---|---|---|---|---|---|
| Benchmark | [-] | 78.2 | |||||||||||||||
| CESM2 | [-] | 86.5 | 86.5 | 75.8 | 83.7 | 11.4 | 16.3 | 2.33 | 0.186 | 0.183 | 0.647 | 0.996 | 0.830 | 0.504 | |||
| ELM_CN | [-] | 88.3 | 88.3 | 74.8 | 83.2 | 13.5 | 18.2 | 2.73 | 0.138 | 0.180 | 0.568 | 0.999 | 0.828 | 0.482 | |||
| ELM_CNP | [-] | 88.3 | 88.3 | 74.8 | 83.2 | 13.5 | 18.2 | 2.73 | 0.138 | 0.179 | 0.568 | 0.999 | 0.828 | 0.482 |
Download Data |
Period Mean (original grids) [%] |
Model Period Mean (intersection) [%] |
Model Period Mean (complement) [%] |
Benchmark Period Mean (intersection) [%] |
Benchmark Period Mean (complement) [%] |
Bias [%] |
RMSE [%] |
Phase Shift [months] |
Bias Score [1] |
RMSE Score [1] |
Seasonal Cycle Score [1] |
Spatial Distribution Score [1] |
Interannual Variability Score [1] |
Overall Score [1] |
|||
|---|---|---|---|---|---|---|---|---|---|---|---|---|---|---|---|---|---|
| Benchmark | [-] | 73.9 | |||||||||||||||
| CESM2 | [-] | 67.3 | 67.2 | 68.5 | 78.0 | 0.404 | 8.82 | 1.62 | 0.509 | 0.415 | 0.755 | 0.992 | 0.822 | 0.651 | |||
| ELM_CN | [-] | 68.7 | 68.7 | 66.3 | 77.8 | 2.62 | 9.37 | 1.62 | 0.550 | 0.435 | 0.756 | 0.988 | 0.855 | 0.670 | |||
| ELM_CNP | [-] | 68.7 | 68.7 | 66.3 | 77.8 | 2.56 | 9.33 | 1.63 | 0.553 | 0.435 | 0.755 | 0.987 | 0.855 | 0.670 |
Download Data |
Period Mean (original grids) [%] |
Model Period Mean (intersection) [%] |
Model Period Mean (complement) [%] |
Benchmark Period Mean (intersection) [%] |
Benchmark Period Mean (complement) [%] |
Bias [%] |
RMSE [%] |
Phase Shift [months] |
Bias Score [1] |
RMSE Score [1] |
Seasonal Cycle Score [1] |
Spatial Distribution Score [1] |
Interannual Variability Score [1] |
Overall Score [1] |
|||
|---|---|---|---|---|---|---|---|---|---|---|---|---|---|---|---|---|---|
| Benchmark | [-] | 60.1 | |||||||||||||||
| CESM2 | [-] | 62.0 | 62.0 | 58.7 | 74.6 | 3.93 | 15.9 | 1.83 | 0.531 | 0.338 | 0.709 | 0.971 | 0.832 | 0.620 | |||
| ELM_CN | [-] | 64.3 | 64.3 | 57.9 | 74.1 | 6.41 | 16.9 | 1.77 | 0.492 | 0.328 | 0.717 | 0.956 | 0.841 | 0.610 | |||
| ELM_CNP | [-] | 64.3 | 64.3 | 57.9 | 74.1 | 6.39 | 16.9 | 1.77 | 0.493 | 0.327 | 0.717 | 0.956 | 0.841 | 0.610 |
Download Data |
Period Mean (original grids) [%] |
Model Period Mean (intersection) [%] |
Model Period Mean (complement) [%] |
Benchmark Period Mean (intersection) [%] |
Benchmark Period Mean (complement) [%] |
Bias [%] |
RMSE [%] |
Phase Shift [months] |
Bias Score [1] |
RMSE Score [1] |
Seasonal Cycle Score [1] |
Spatial Distribution Score [1] |
Interannual Variability Score [1] |
Overall Score [1] |
|||
|---|---|---|---|---|---|---|---|---|---|---|---|---|---|---|---|---|---|
| Benchmark | [-] | 81.8 | |||||||||||||||
| CESM2 | [-] | 85.1 | 85.1 | 84.5 | 80.3 | -0.478 | 3.83 | 1.44 | 0.596 | 0.393 | 0.797 | 0.996 | 0.779 | 0.659 | |||
| ELM_CN | [-] | 86.9 | 86.9 | 85.9 | 80.6 | 0.987 | 4.36 | 1.38 | 0.590 | 0.400 | 0.800 | 0.998 | 0.766 | 0.659 | |||
| ELM_CNP | [-] | 86.7 | 86.7 | 85.9 | 80.6 | 0.746 | 4.29 | 1.38 | 0.599 | 0.400 | 0.801 | 0.999 | 0.767 | 0.661 |
Download Data |
Period Mean (original grids) [%] |
Model Period Mean (intersection) [%] |
Model Period Mean (complement) [%] |
Benchmark Period Mean (intersection) [%] |
Benchmark Period Mean (complement) [%] |
Bias [%] |
RMSE [%] |
Phase Shift [months] |
Bias Score [1] |
RMSE Score [1] |
Seasonal Cycle Score [1] |
Spatial Distribution Score [1] |
Interannual Variability Score [1] |
Overall Score [1] |
|||
|---|---|---|---|---|---|---|---|---|---|---|---|---|---|---|---|---|---|
| Benchmark | [-] | 77.1 | |||||||||||||||
| CESM2 | [-] | 76.6 | 76.8 | 76.1 | 79.3 | 0.561 | 8.68 | 1.29 | 0.601 | 0.358 | 0.847 | 0.786 | 0.818 | 0.628 | |||
| ELM_CN | [-] | 78.4 | 78.4 | 75.7 | 78.9 | 2.66 | 9.29 | 1.11 | 0.593 | 0.382 | 0.888 | 0.759 | 0.831 | 0.639 | |||
| ELM_CNP | [-] | 78.3 | 78.3 | 75.7 | 78.9 | 2.57 | 9.32 | 1.11 | 0.596 | 0.379 | 0.887 | 0.758 | 0.831 | 0.638 |
Download Data |
Period Mean (original grids) [%] |
Model Period Mean (intersection) [%] |
Model Period Mean (complement) [%] |
Benchmark Period Mean (intersection) [%] |
Benchmark Period Mean (complement) [%] |
Bias [%] |
RMSE [%] |
Phase Shift [months] |
Bias Score [1] |
RMSE Score [1] |
Seasonal Cycle Score [1] |
Spatial Distribution Score [1] |
Interannual Variability Score [1] |
Overall Score [1] |
|||
|---|---|---|---|---|---|---|---|---|---|---|---|---|---|---|---|---|---|
| Benchmark | [-] | 65.7 | |||||||||||||||
| CESM2 | [-] | 69.6 | 69.6 | 65.0 | 78.8 | 5.44 | 13.8 | 1.49 | 0.407 | 0.340 | 0.772 | 0.938 | 0.765 | 0.594 | |||
| ELM_CN | [-] | 69.1 | 69.1 | 63.5 | 73.9 | 5.71 | 13.5 | 1.47 | 0.433 | 0.355 | 0.767 | 0.986 | 0.798 | 0.616 | |||
| ELM_CNP | [-] | 69.1 | 69.1 | 63.5 | 73.9 | 5.65 | 13.6 | 1.47 | 0.433 | 0.355 | 0.767 | 0.986 | 0.798 | 0.615 |
Download Data |
Period Mean (original grids) [%] |
Model Period Mean (intersection) [%] |
Model Period Mean (complement) [%] |
Benchmark Period Mean (intersection) [%] |
Benchmark Period Mean (complement) [%] |
Bias [%] |
RMSE [%] |
Phase Shift [months] |
Bias Score [1] |
RMSE Score [1] |
Seasonal Cycle Score [1] |
Spatial Distribution Score [1] |
Interannual Variability Score [1] |
Overall Score [1] |
|||
|---|---|---|---|---|---|---|---|---|---|---|---|---|---|---|---|---|---|
| Benchmark | [-] | 44.3 | |||||||||||||||
| CESM2 | [-] | 43.6 | 44.0 | 40.6 | 72.7 | 5.33 | 11.3 | 0.615 | 0.518 | 0.464 | 0.894 | 0.917 | 0.789 | 0.674 | |||
| ELM_CN | [-] | 44.8 | 44.8 | 37.7 | 71.7 | 7.21 | 11.9 | 0.389 | 0.552 | 0.506 | 0.952 | 0.917 | 0.822 | 0.709 | |||
| ELM_CNP | [-] | 44.7 | 44.7 | 37.7 | 71.7 | 7.21 | 11.9 | 0.388 | 0.552 | 0.506 | 0.952 | 0.917 | 0.822 | 0.709 |
Download Data |
Period Mean (original grids) [%] |
Model Period Mean (intersection) [%] |
Model Period Mean (complement) [%] |
Benchmark Period Mean (intersection) [%] |
Benchmark Period Mean (complement) [%] |
Bias [%] |
RMSE [%] |
Phase Shift [months] |
Bias Score [1] |
RMSE Score [1] |
Seasonal Cycle Score [1] |
Spatial Distribution Score [1] |
Interannual Variability Score [1] |
Overall Score [1] |
|||
|---|---|---|---|---|---|---|---|---|---|---|---|---|---|---|---|---|---|
| Benchmark | [-] | 56.8 | |||||||||||||||
| CESM2 | [-] | 51.3 | 50.4 | 52.3 | 80.0 | -1.26 | 12.6 | 0.941 | 0.564 | 0.475 | 0.844 | 0.927 | 0.752 | 0.673 | |||
| ELM_CN | [-] | 52.3 | 52.3 | 51.5 | 79.4 | 0.844 | 12.6 | 0.916 | 0.594 | 0.497 | 0.852 | 0.916 | 0.764 | 0.686 | |||
| ELM_CNP | [-] | 52.2 | 52.2 | 51.5 | 79.4 | 0.775 | 12.6 | 0.916 | 0.591 | 0.496 | 0.852 | 0.912 | 0.762 | 0.685 |
Download Data |
Period Mean (original grids) [%] |
Model Period Mean (intersection) [%] |
Model Period Mean (complement) [%] |
Benchmark Period Mean (intersection) [%] |
Benchmark Period Mean (complement) [%] |
Bias [%] |
RMSE [%] |
Phase Shift [months] |
Bias Score [1] |
RMSE Score [1] |
Seasonal Cycle Score [1] |
Spatial Distribution Score [1] |
Interannual Variability Score [1] |
Overall Score [1] |
|||
|---|---|---|---|---|---|---|---|---|---|---|---|---|---|---|---|---|---|
| Benchmark | [-] | 82.9 | |||||||||||||||
| CESM2 | [-] | 81.5 | 81.6 | 84.0 | 80.1 | -2.04 | 7.53 | 1.45 | 0.494 | 0.400 | 0.788 | 0.887 | 0.771 | 0.623 | |||
| ELM_CN | [-] | 83.3 | 83.3 | 84.2 | 80.7 | -0.846 | 7.15 | 1.23 | 0.546 | 0.434 | 0.823 | 0.928 | 0.786 | 0.659 | |||
| ELM_CNP | [-] | 83.2 | 83.2 | 84.2 | 80.7 | -0.959 | 7.21 | 1.23 | 0.543 | 0.433 | 0.823 | 0.925 | 0.786 | 0.657 |
Download Data |
Period Mean (original grids) [%] |
Model Period Mean (intersection) [%] |
Model Period Mean (complement) [%] |
Benchmark Period Mean (intersection) [%] |
Benchmark Period Mean (complement) [%] |
Bias [%] |
RMSE [%] |
Phase Shift [months] |
Bias Score [1] |
RMSE Score [1] |
Seasonal Cycle Score [1] |
Spatial Distribution Score [1] |
Interannual Variability Score [1] |
Overall Score [1] |
|||
|---|---|---|---|---|---|---|---|---|---|---|---|---|---|---|---|---|---|
| Benchmark | [-] | 73.9 | |||||||||||||||
| CESM2 | [-] | 68.0 | 68.0 | 70.5 | 78.8 | -0.989 | 10.2 | 1.00 | 0.580 | 0.435 | 0.858 | 0.908 | 0.789 | 0.668 | |||
| ELM_CN | [-] | 70.4 | 70.4 | 69.2 | 78.8 | 1.28 | 11.1 | 1.05 | 0.576 | 0.440 | 0.853 | 0.898 | 0.798 | 0.667 | |||
| ELM_CNP | [-] | 70.3 | 70.3 | 69.2 | 78.8 | 1.22 | 11.1 | 1.05 | 0.577 | 0.440 | 0.854 | 0.897 | 0.799 | 0.668 |
Download Data |
Period Mean (original grids) [%] |
Model Period Mean (intersection) [%] |
Model Period Mean (complement) [%] |
Benchmark Period Mean (intersection) [%] |
Benchmark Period Mean (complement) [%] |
Bias [%] |
RMSE [%] |
Phase Shift [months] |
Bias Score [1] |
RMSE Score [1] |
Seasonal Cycle Score [1] |
Spatial Distribution Score [1] |
Interannual Variability Score [1] |
Overall Score [1] |
|||
|---|---|---|---|---|---|---|---|---|---|---|---|---|---|---|---|---|---|
| Benchmark | [-] | 69.1 | |||||||||||||||
| CESM2 | [-] | 61.9 | 62.1 | 65.9 | 77.9 | -2.77 | 11.9 | 1.13 | 0.522 | 0.423 | 0.839 | 0.919 | 0.736 | 0.644 | |||
| ELM_CN | [-] | 63.7 | 63.7 | 64.7 | 78.1 | -0.899 | 12.0 | 1.03 | 0.533 | 0.438 | 0.860 | 0.907 | 0.757 | 0.656 | |||
| ELM_CNP | [-] | 63.5 | 63.5 | 64.7 | 78.1 | -1.07 | 12.1 | 1.04 | 0.533 | 0.438 | 0.859 | 0.902 | 0.755 | 0.654 |
Download Data |
Period Mean (original grids) [%] |
Model Period Mean (intersection) [%] |
Model Period Mean (complement) [%] |
Benchmark Period Mean (intersection) [%] |
Benchmark Period Mean (complement) [%] |
Bias [%] |
RMSE [%] |
Phase Shift [months] |
Bias Score [1] |
RMSE Score [1] |
Seasonal Cycle Score [1] |
Spatial Distribution Score [1] |
Interannual Variability Score [1] |
Overall Score [1] |
|||
|---|---|---|---|---|---|---|---|---|---|---|---|---|---|---|---|---|---|
| Benchmark | [-] | 77.0 | |||||||||||||||
| CESM2 | [-] | 72.7 | 72.9 | 74.4 | 80.1 | -1.33 | 12.2 | 1.25 | 0.435 | 0.319 | 0.840 | 0.994 | 0.678 | 0.597 | |||
| ELM_CN | [-] | 74.8 | 74.8 | 74.2 | 80.0 | 0.614 | 11.8 | 1.21 | 0.467 | 0.338 | 0.848 | 0.995 | 0.714 | 0.617 | |||
| ELM_CNP | [-] | 74.6 | 74.6 | 74.2 | 80.0 | 0.431 | 11.8 | 1.22 | 0.465 | 0.337 | 0.846 | 0.994 | 0.711 | 0.615 |
Download Data |
Period Mean (original grids) [%] |
Model Period Mean (intersection) [%] |
Model Period Mean (complement) [%] |
Benchmark Period Mean (intersection) [%] |
Benchmark Period Mean (complement) [%] |
Bias [%] |
RMSE [%] |
Phase Shift [months] |
Bias Score [1] |
RMSE Score [1] |
Seasonal Cycle Score [1] |
Spatial Distribution Score [1] |
Interannual Variability Score [1] |
Overall Score [1] |
|||
|---|---|---|---|---|---|---|---|---|---|---|---|---|---|---|---|---|---|
| Benchmark | [-] | 64.7 | |||||||||||||||
| CESM2 | [-] | 71.6 | 71.5 | 62.5 | 78.0 | 9.21 | 13.6 | 1.68 | 0.355 | 0.332 | 0.741 | 0.979 | 0.830 | 0.595 | |||
| ELM_CN | [-] | 73.7 | 73.7 | 61.7 | 77.6 | 12.0 | 15.4 | 1.53 | 0.273 | 0.345 | 0.768 | 0.989 | 0.835 | 0.593 | |||
| ELM_CNP | [-] | 73.7 | 73.7 | 61.7 | 77.6 | 12.0 | 15.4 | 1.53 | 0.273 | 0.345 | 0.768 | 0.989 | 0.836 | 0.593 |
Temporally integrated period mean