Mean State
Download Data |
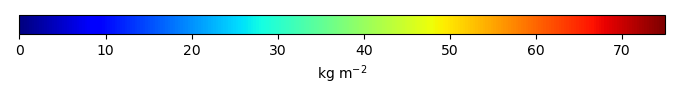
Period Mean (original grids) [Pg] |
Model Period Mean (intersection) [Pg] |
Model Period Mean (complement) [Pg] |
Benchmark Period Mean (intersection) [Pg] |
Benchmark Period Mean (complement) [Pg] |
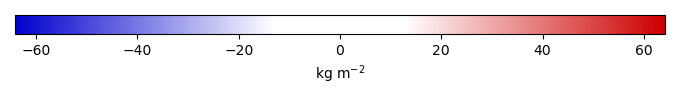
Bias [kg m-2] |
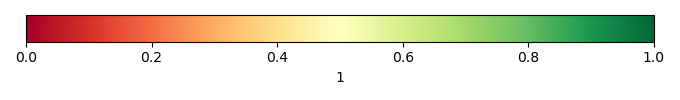
Bias Score [1] |
Spatial Distribution Score [1] |
Overall Score [1] |
|||
|---|---|---|---|---|---|---|---|---|---|---|---|---|
| Benchmark | [-] | 222. | ||||||||||
| CESM2 | [-] | 253. | 193. | 56.2 | 224. | 0.348 | -3.76 | 0.555 | 0.531 | 0.543 | ||
| CMCC-ESM2 | [-] | 298. | 207. | 88.9 | 223. | 0.778 | -1.97 | 0.610 | 0.808 | 0.709 | ||
| ELM_CN | [-] | 252. | 205. | 46.5 | 220. | 2.31 | -1.74 | 0.662 | 0.898 | 0.780 | ||
| ELM_CNP | [-] | 245. | 199. | 46.0 | 220. | 2.31 | -2.58 | 0.661 | 0.902 | 0.782 | ||
| IPSL-CM6A-LR | [-] | 48.6 | 29.4 | 20.1 | 220. | 0.450 | -23.9 | 0.423 | 0.0269 | 0.225 | ||
| MPI-ESM1-2-LR | [-] | 125. | 81.1 | 36.4 | 219. | 3.23 | -17.5 | 0.535 | 0.324 | 0.429 |
Download Data |
Period Mean (original grids) [Pg] |
Model Period Mean (intersection) [Pg] |
Model Period Mean (complement) [Pg] |
Benchmark Period Mean (intersection) [Pg] |
Benchmark Period Mean (complement) [Pg] |
Bias [kg m-2] |
Bias Score [1] |
Spatial Distribution Score [1] |
Overall Score [1] |
|||
|---|---|---|---|---|---|---|---|---|---|---|---|---|
| Benchmark | [-] | 160. | ||||||||||
| CESM2 | [-] | 184. | 150. | 34.9 | 159. | 0.709 | -0.621 | 0.514 | 0.692 | 0.603 | ||
| CMCC-ESM2 | [-] | 239. | 188. | 51.1 | 158. | 2.30 | 3.80 | 0.532 | 0.754 | 0.643 | ||
| ELM_CN | [-] | 151. | 126. | 25.5 | 154. | 5.76 | -3.57 | 0.532 | 0.772 | 0.652 | ||
| ELM_CNP | [-] | 145. | 121. | 24.6 | 154. | 5.76 | -4.19 | 0.525 | 0.757 | 0.641 | ||
| IPSL-CM6A-LR | [-] | 34.2 | 24.6 | 9.98 | 159. | 1.38 | -16.6 | 0.434 | 0.0564 | 0.245 | ||
| MPI-ESM1-2-LR | [-] | 106. | 84.4 | 24.3 | 147. | 13.5 | -8.18 | 0.555 | 0.259 | 0.407 |
Download Data |
Period Mean (original grids) [Pg] |
Model Period Mean (intersection) [Pg] |
Model Period Mean (complement) [Pg] |
Benchmark Period Mean (intersection) [Pg] |
Benchmark Period Mean (complement) [Pg] |
Bias [kg m-2] |
Bias Score [1] |
Spatial Distribution Score [1] |
Overall Score [1] |
|||
|---|---|---|---|---|---|---|---|---|---|---|---|---|
| Benchmark | [-] | 44.9 | ||||||||||
| CESM2 | [-] | 120. | 28.2 | 91.6 | 42.9 | 0.00185 | -5.75 | 0.597 | 0.877 | 0.737 | ||
| CMCC-ESM2 | [-] | 229. | 60.7 | 168. | 42.9 | 0.00185 | 7.02 | 0.604 | 0.788 | 0.696 | ||
| ELM_CN | [-] | 148. | 44.6 | 103. | 44.8 | 0.137 | -0.0389 | 0.668 | 0.920 | 0.794 | ||
| ELM_CNP | [-] | 145. | 44.0 | 101. | 44.8 | 0.137 | -0.278 | 0.667 | 0.920 | 0.794 | ||
| IPSL-CM6A-LR | [-] | 48.4 | 7.10 | 39.1 | 44.9 | -14.2 | 0.434 | 0.0884 | 0.261 | |||
| MPI-ESM1-2-LR | [-] | 92.7 | 15.9 | 79.6 | 44.7 | 0.174 | -10.8 | 0.530 | 0.278 | 0.404 |
Download Data |
Period Mean (original grids) [Pg] |
Model Period Mean (intersection) [Pg] |
Model Period Mean (complement) [Pg] |
Benchmark Period Mean (intersection) [Pg] |
Benchmark Period Mean (complement) [Pg] |
Bias [kg m-2] |
Bias Score [1] |
Spatial Distribution Score [1] |
Overall Score [1] |
|||
|---|---|---|---|---|---|---|---|---|---|---|---|---|
| Benchmark | [-] | 5.18 | ||||||||||
| CESM2 | [-] | 51.4 | 3.51 | 47.0 | 5.18 | -6.50 | 0.639 | 0.560 | 0.600 | |||
| CMCC-ESM2 | [-] | 115. | 4.56 | 109. | 5.18 | -2.47 | 0.709 | 0.725 | 0.717 | |||
| ELM_CN | [-] | 61.8 | 3.60 | 58.2 | 5.18 | -6.00 | 0.605 | 0.587 | 0.596 | |||
| ELM_CNP | [-] | 60.9 | 3.60 | 57.3 | 5.18 | -6.00 | 0.605 | 0.586 | 0.595 | |||
| IPSL-CM6A-LR | [-] | 38.2 | 1.42 | 35.8 | 5.17 | -14.4 | 0.481 | 0.129 | 0.305 | |||
| MPI-ESM1-2-LR | [-] | 38.4 | 2.55 | 35.0 | 5.18 | -9.97 | 0.563 | 0.309 | 0.436 |
Download Data |
Period Mean (original grids) [Pg] |
Model Period Mean (intersection) [Pg] |
Model Period Mean (complement) [Pg] |
Benchmark Period Mean (intersection) [Pg] |
Benchmark Period Mean (complement) [Pg] |
Bias [kg m-2] |
Bias Score [1] |
Spatial Distribution Score [1] |
Overall Score [1] |
|||
|---|---|---|---|---|---|---|---|---|---|---|---|---|
| Benchmark | [-] | 473. | ||||||||||
| CESM2 | [-] | 1.05e+03 | 432. | 617. | 472. | 0.940 | -1.43 | 0.536 | 0.642 | 0.589 | ||
| CMCC-ESM2 | [-] | 1.57e+03 | 479. | 1.08e+03 | 470. | 2.96 | 0.459 | 0.576 | 0.811 | 0.694 | ||
| ELM_CN | [-] | 1.18e+03 | 409. | 770. | 464. | 9.31 | -2.41 | 0.612 | 0.870 | 0.741 | ||
| ELM_CNP | [-] | 1.13e+03 | 396. | 734. | 464. | 9.31 | -3.03 | 0.609 | 0.867 | 0.738 | ||
| IPSL-CM6A-LR | [-] | 485. | 67.2 | 416. | 470. | 2.37 | -19.3 | 0.428 | 0.0571 | 0.242 | ||
| MPI-ESM1-2-LR | [-] | 657. | 199. | 494. | 453. | 19.8 | -11.8 | 0.541 | 0.375 | 0.458 |
Download Data |
Period Mean (original grids) [Pg] |
Model Period Mean (intersection) [Pg] |
Model Period Mean (complement) [Pg] |
Benchmark Period Mean (intersection) [Pg] |
Benchmark Period Mean (complement) [Pg] |
Bias [kg m-2] |
Bias Score [1] |
Spatial Distribution Score [1] |
Overall Score [1] |
|||
|---|---|---|---|---|---|---|---|---|---|---|---|---|
| Benchmark | [-] | 0.539 | ||||||||||
| CESM2 | [-] | 52.8 | 0.847 | 51.8 | 0.523 | 2.65 | 0.490 | 0.699 | 0.595 | |||
| CMCC-ESM2 | [-] | 115. | 1.12 | 113. | 0.523 | 5.78 | 0.475 | 0.886 | 0.680 | |||
| ELM_CN | [-] | 82.4 | 0.964 | 81.5 | 0.539 | 4.54 | 0.481 | 0.910 | 0.695 | |||
| ELM_CNP | [-] | 81.7 | 0.962 | 80.7 | 0.539 | 4.52 | 0.483 | 0.910 | 0.696 | |||
| IPSL-CM6A-LR | [-] | 38.5 | 0.453 | 36.8 | 0.539 | -0.842 | 0.692 | 0.658 | 0.675 | |||
| MPI-ESM1-2-LR | [-] | 53.7 | 0.966 | 50.5 | 0.539 | 4.31 | 0.520 | 0.917 | 0.718 |
Temporally integrated period mean