Mean State
Download Data |
Period Mean (original grids) [Pg] |
Model Period Mean (intersection) [Pg] |
Model Period Mean (complement) [Pg] |
Benchmark Period Mean (intersection) [Pg] |
Benchmark Period Mean (complement) [Pg] |
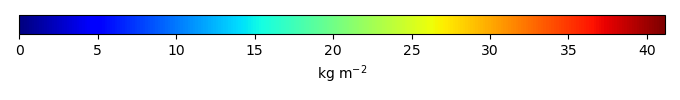
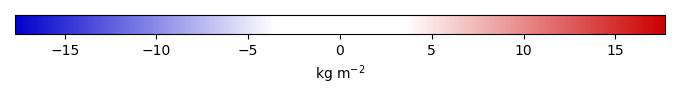
Bias [kg m-2] |
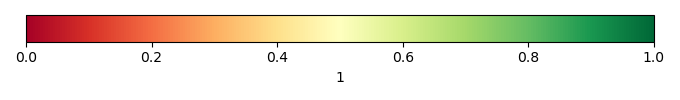
Bias Score [1] |
Spatial Distribution Score [1] |
Overall Score [1] |
|||
|---|---|---|---|---|---|---|---|---|---|---|---|---|
| Benchmark | [-] | 2.76 | ||||||||||
| CESM2 | [-] | 46.8 | 7.21 | 39.8 | 2.66 | 0.105 | 4.11 | 0.428 | 0.836 | 0.632 | ||
| CMCC-ESM2 | [-] | 27.5 | 3.79 | 23.8 | 2.56 | 0.206 | 0.928 | 0.520 | 0.461 | 0.490 | ||
| ELM_CN | [-] | 30.6 | 4.30 | 26.3 | 2.59 | 0.170 | 1.38 | 0.520 | 0.474 | 0.497 | ||
| ELM_CNP | [-] | 29.6 | 4.25 | 25.3 | 2.59 | 0.170 | 1.33 | 0.515 | 0.478 | 0.496 | ||
| IPSL-CM6A-LR | [-] | 15.5 | 2.48 | 13.3 | 2.66 | 0.110 | 0.273 | 0.543 | 0.560 | 0.551 | ||
| MPI-ESM1-2-LR | [-] | 24.8 | 4.10 | 21.9 | 2.52 | 0.241 | 1.18 | 0.559 | 0.674 | 0.617 |
Download Data |
Period Mean (original grids) [Pg] |
Model Period Mean (intersection) [Pg] |
Model Period Mean (complement) [Pg] |
Benchmark Period Mean (intersection) [Pg] |
Benchmark Period Mean (complement) [Pg] |
Bias [kg m-2] |
Bias Score [1] |
Spatial Distribution Score [1] |
Overall Score [1] |
|||
|---|---|---|---|---|---|---|---|---|---|---|---|---|
| Benchmark | [-] | 0.878 | ||||||||||
| CESM2 | [-] | 8.60 | 0.448 | 7.95 | 0.588 | 0.00736 | 0.400 | 0.586 | 0.831 | 0.708 | ||
| CMCC-ESM2 | [-] | 8.39 | 0.721 | 7.25 | 0.585 | 0.0109 | 0.168 | 0.624 | 0.759 | 0.692 | ||
| ELM_CN | [-] | 11.4 | 1.72 | 9.72 | 0.825 | 0.0537 | 2.24 | 0.625 | 0.832 | 0.729 | ||
| ELM_CNP | [-] | 11.0 | 1.64 | 9.39 | 0.825 | 0.0537 | 1.99 | 0.642 | 0.864 | 0.753 | ||
| IPSL-CM6A-LR | [-] | 6.89 | 0.814 | 6.68 | 0.842 | 0.0362 | 1.20 | 0.585 | 0.825 | 0.705 | ||
| MPI-ESM1-2-LR | [-] | 5.70 | 1.44 | 5.22 | 0.681 | 0.197 | 2.13 | 0.619 | 0.855 | 0.737 |
Download Data |
Period Mean (original grids) [Pg] |
Model Period Mean (intersection) [Pg] |
Model Period Mean (complement) [Pg] |
Benchmark Period Mean (intersection) [Pg] |
Benchmark Period Mean (complement) [Pg] |
Bias [kg m-2] |
Bias Score [1] |
Spatial Distribution Score [1] |
Overall Score [1] |
|||
|---|---|---|---|---|---|---|---|---|---|---|---|---|
| Benchmark | [-] | 30.1 | ||||||||||
| CESM2 | [-] | 489. | 22.4 | 465. | 29.9 | 0.176 | -0.479 | 0.574 | 0.772 | 0.673 | ||
| CMCC-ESM2 | [-] | 437. | 21.3 | 413. | 29.9 | 0.248 | -0.938 | 0.573 | 0.646 | 0.609 | ||
| ELM_CN | [-] | 622. | 32.0 | 590. | 29.6 | 0.521 | 0.315 | 0.662 | 0.779 | 0.720 | ||
| ELM_CNP | [-] | 569. | 31.5 | 538. | 29.6 | 0.521 | 0.248 | 0.663 | 0.771 | 0.717 | ||
| IPSL-CM6A-LR | [-] | 313. | 15.1 | 296. | 29.8 | 0.329 | -1.32 | 0.560 | 0.445 | 0.502 | ||
| MPI-ESM1-2-LR | [-] | 387. | 28.3 | 358. | 29.0 | 1.09 | -0.0553 | 0.614 | 0.545 | 0.580 |
Download Data |
Period Mean (original grids) [Pg] |
Model Period Mean (intersection) [Pg] |
Model Period Mean (complement) [Pg] |
Benchmark Period Mean (intersection) [Pg] |
Benchmark Period Mean (complement) [Pg] |
Bias [kg m-2] |
Bias Score [1] |
Spatial Distribution Score [1] |
Overall Score [1] |
|||
|---|---|---|---|---|---|---|---|---|---|---|---|---|
| Benchmark | [-] | 26.5 | ||||||||||
| CESM2 | [-] | 24.5 | 14.8 | 9.49 | 26.7 | 0.0803 | -1.38 | 0.588 | 0.700 | 0.644 | ||
| CMCC-ESM2 | [-] | 26.7 | 16.8 | 9.45 | 26.7 | 0.0692 | -1.34 | 0.576 | 0.674 | 0.625 | ||
| ELM_CN | [-] | 34.1 | 26.0 | 8.09 | 26.2 | 0.322 | -0.000797 | 0.677 | 0.807 | 0.742 | ||
| ELM_CNP | [-] | 33.6 | 25.6 | 8.00 | 26.2 | 0.322 | -0.0594 | 0.678 | 0.801 | 0.740 | ||
| IPSL-CM6A-LR | [-] | 16.1 | 11.8 | 3.59 | 26.3 | 0.188 | -1.79 | 0.561 | 0.420 | 0.490 | ||
| MPI-ESM1-2-LR | [-] | 33.3 | 22.7 | 8.77 | 25.8 | 0.682 | -0.401 | 0.619 | 0.517 | 0.568 |
Temporally integrated period mean