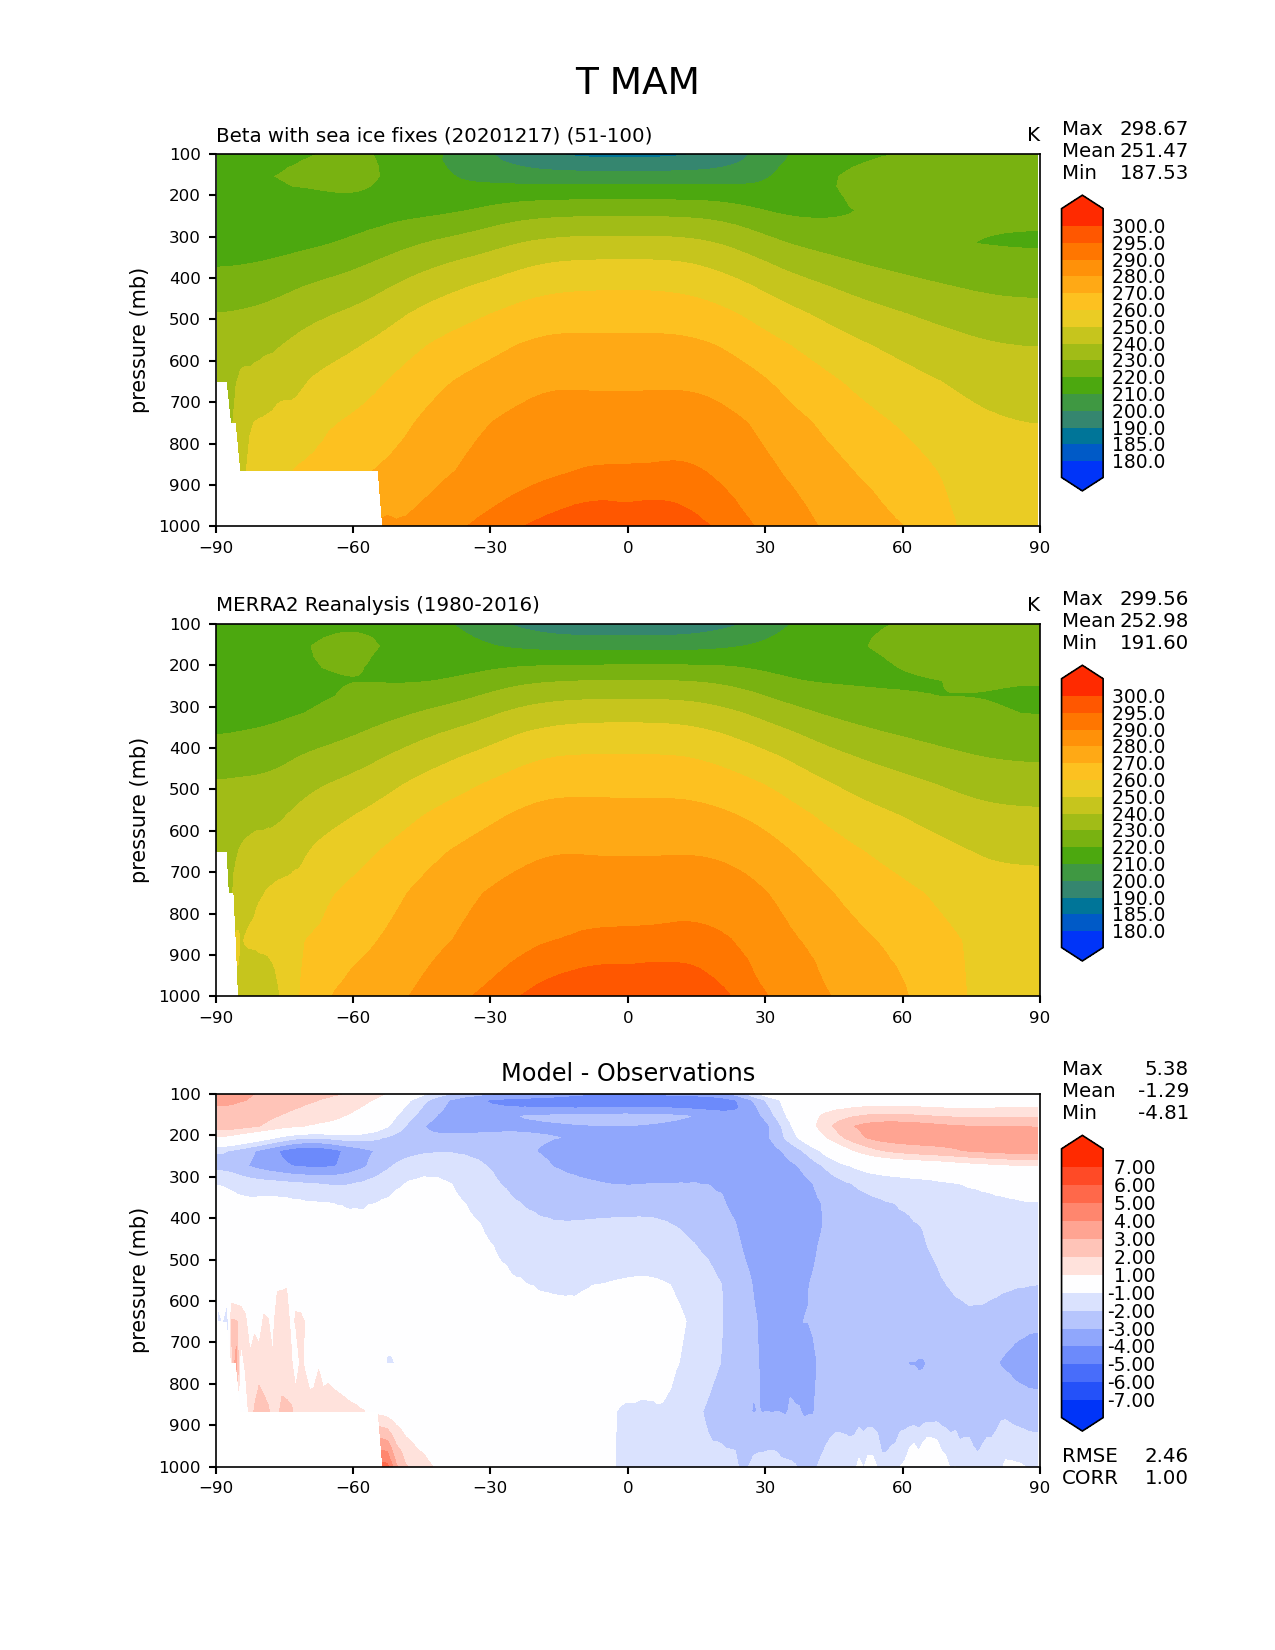
| Use this command to recreate this image: | e3sm_diags zonal_mean_2d --no_viewer --case_id 'MERRA2' --sets 'zonal_mean_2d' --run_type 'model_vs_obs' --variables 'T' --seasons 'MAM' --regions 'global' --regrid_tool 'esmf' --regrid_method 'conservative' --plevs '100.0' '115.47819846894582' '133.3521432163324' '153.9926526059492' '177.82794100389228' '205.3525026457146' '237.13737056616552' '273.8419634264361' '316.22776601683796' '365.1741272548377' '421.6965034285823' '486.9675251658631' '562.341325190349' '649.3816315762114' '749.8942093324558' '865.9643233600654' '1000.0' --main_title 'T MAM' --backend 'mpl' --output_format 'png' --output_format_subplot 'pdf' --canvas_size_w '1212' --canvas_size_h '1628' --figsize '8.5' '11.0' --dpi '150' --arrows --contour_levels '180' '185' '190' '200' '210' '220' '230' '240' '250' '260' '270' '280' '290' '295' '300' --test_name '20201217.beta1_01.piControlSI.compy' --short_test_name 'Beta with sea ice fixes (20201217)' --test_colormap 'cet_rainbow.rgb' --ref_name 'MERRA2' --reference_name 'MERRA2 Reanalysis' --reference_colormap 'cet_rainbow.rgb' --diff_title 'Model - Observations' --diff_colormap 'diverging_bwr.rgb' --diff_levels '-7' '-6' '-5' '-4' '-3' '-2' '-1' '1' '2' '3' '4' '5' '6' '7' --multiprocessing --num_workers '24' --granulate 'variables' 'seasons' 'regions' --selectors 'sets' 'seasons' --test_data_path 'climo' --reference_data_path '/compyfs/e3sm_diags_data/obs_for_e3sm_diags/climatology' --results_dir 'model_vs_obs_0051-0100' |